The Queue Health Report offers a quick, comprehensive view of your main Contact Center queue metrics, helping you keep them optimized.
This out-of-the-box report lets you track key metrics like wait time and call handle time to improve queue flow, boost overall contact center efficiency, and enhance customer support.
Let’s dive into the details.
Who can use this
The Queue Health Report supports Voice and Digital Contact Center channels and can be used by Contact Center Admins and Supervisors.
Access the Queue Health Report
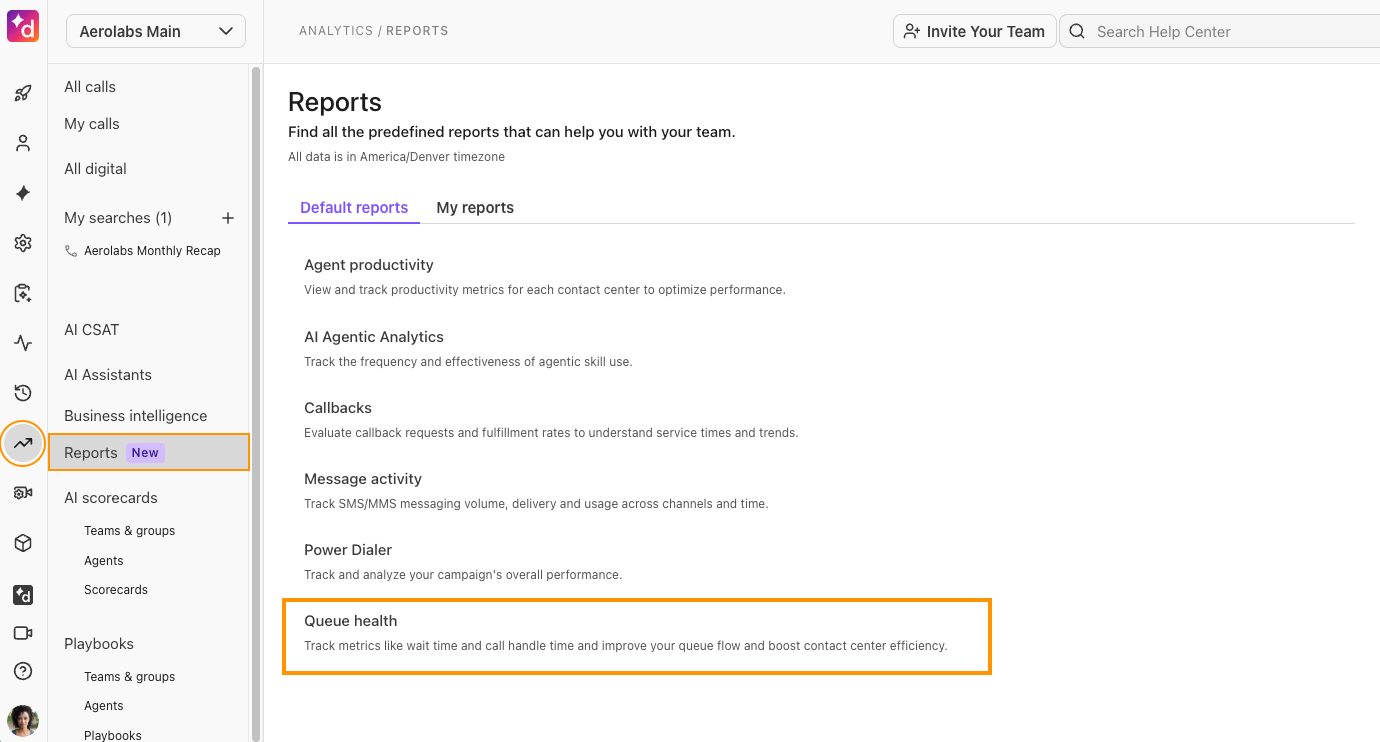
To access the Queue Health Report, go to the Dialpad Admin Portal.
Select Analytics
Select Reports
Select Queue health
Filter by Contact Center(s), timeframe, Channels (for Digital Contact Centers only), and Expertise (for Digital Contact Centers only)
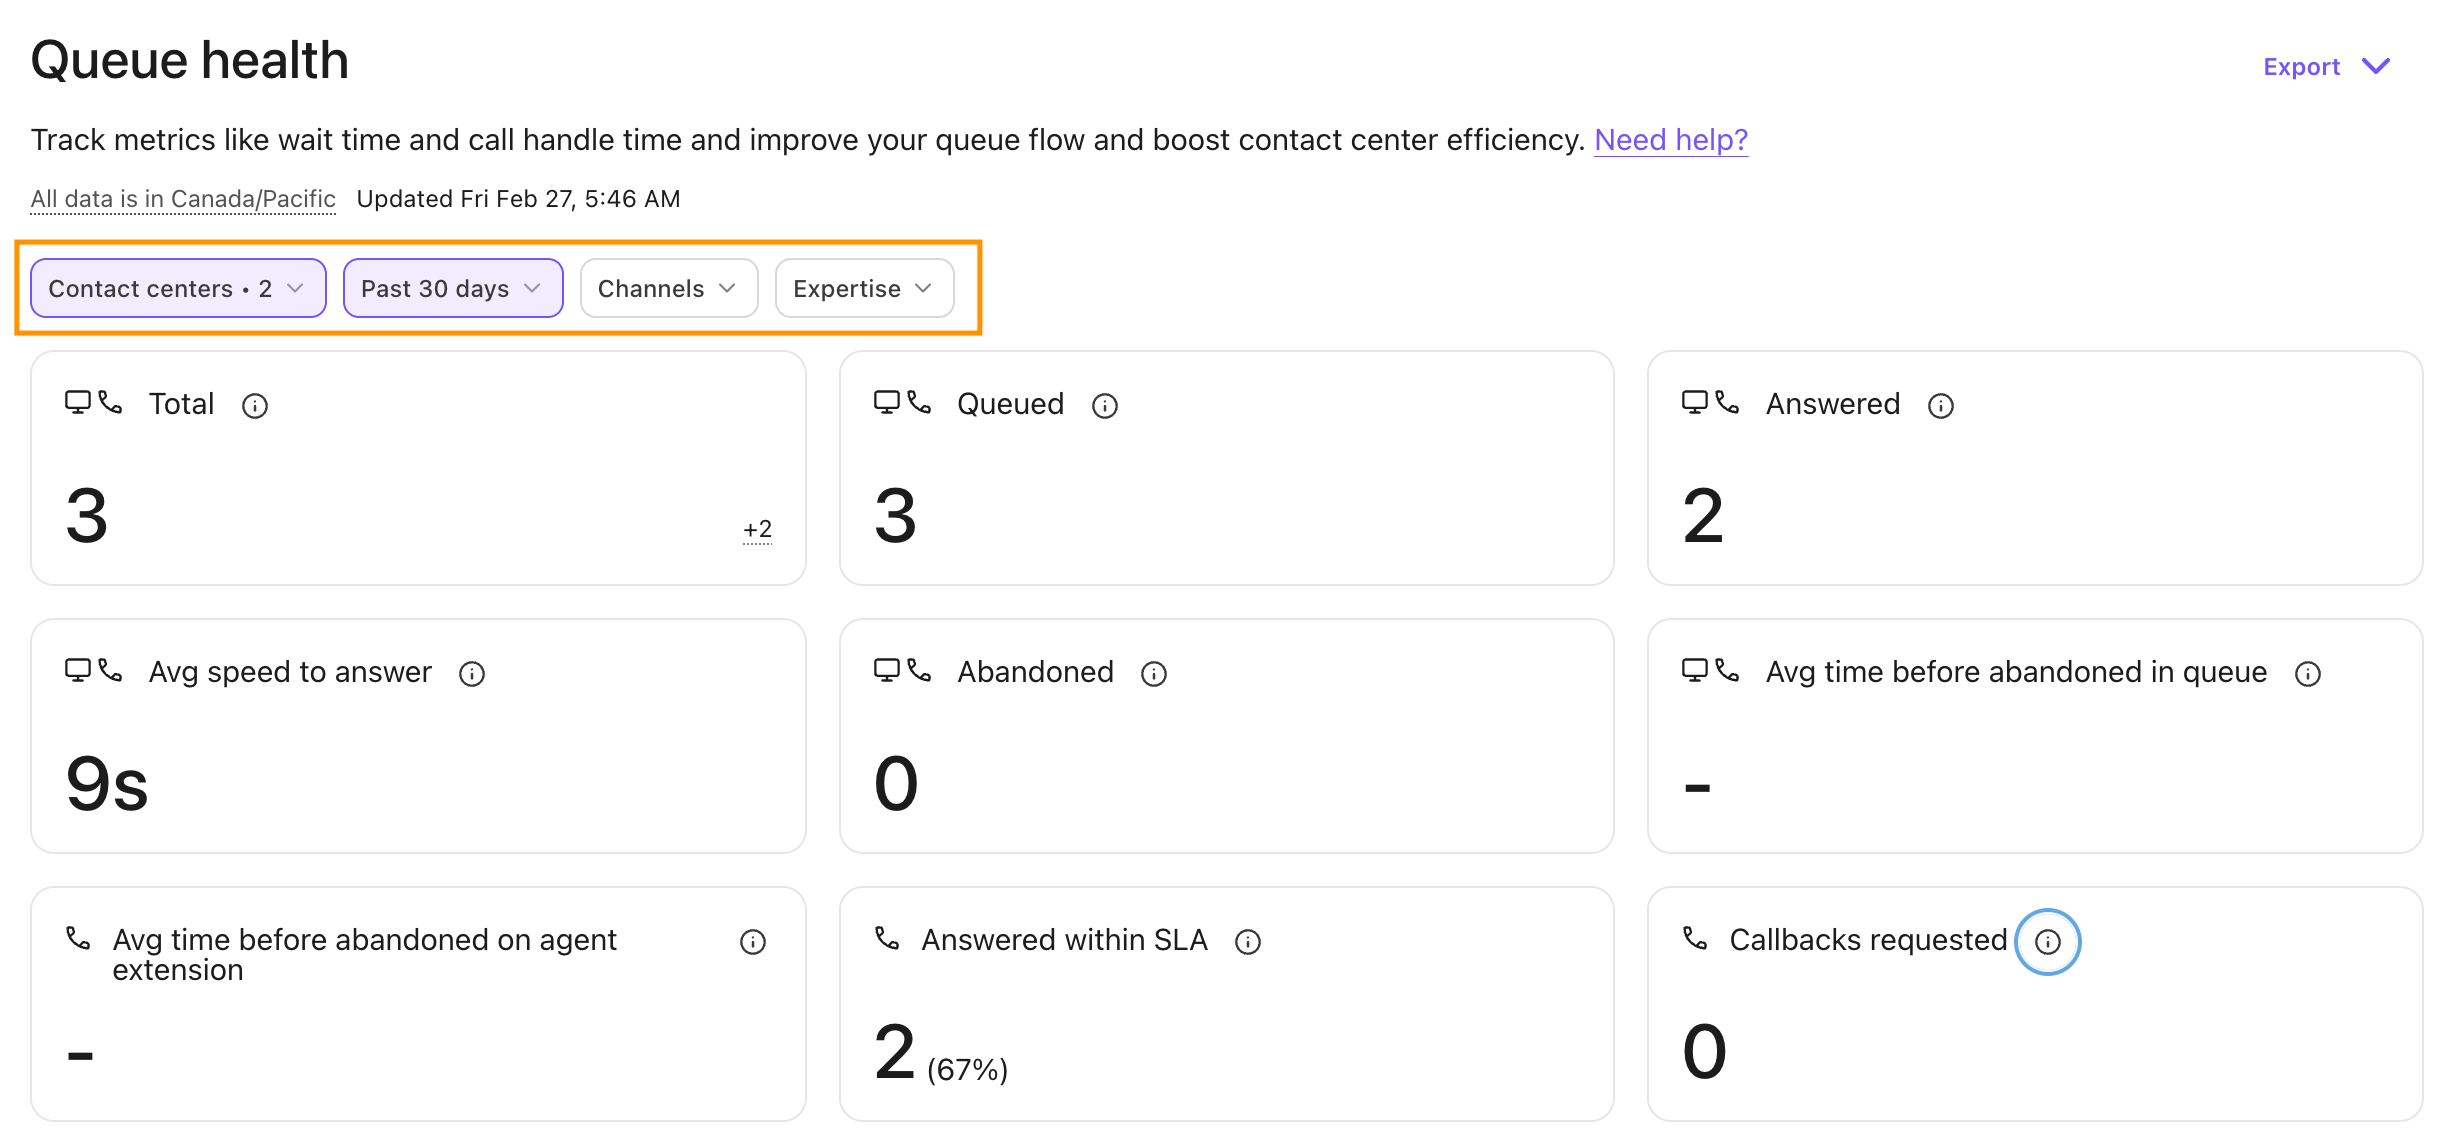
You’ll see aggregated data based on your filters and a leaderboard that shows contact center-level insight such as the total number of connected outbound calls, average wait time, average speed to answer, and more.
Queue Health Report metrics
The Queue Health Report offers the following metrics for Voice Contact Centers.
Metric | Definition |
|---|---|
Total Conversations | The total number of conversations within the selected period and group. Submetrics:
|
Queued | Total number of conversations that went into the hold queue at least once in the conversation flow. |
Answered | Total number of inbound conversations answered by an agent. |
Answered within SLA | Total number of calls that were answered within your defined SLA threshold. |
Average Speed to Answer | The average wait time the caller experienced before being connected to an agent. *For digital contact centers, this is noted as Agent First Response Time. Notes:
|
Abandoned | Total number of inbound conversations that did not ring any agents and were not forwarded through alternative routing options. |
Average time before abandoned in queue | The average time that users wait in queue before they abandon the conversation. |
Average time before abandoned on agent extension | Average time before the conversation abandoned on an agent’s extension. |
Callbacks requested | Total callbacks requested by the customer in the time period selected. |
Outbound: cancelled | The total number of outbound calls that were terminated before being connected to a person or voicemail. |
Outbound: connected | The total number of outbound calls that connected to a person or voicemail. |
Longest speed to answer | The maximum time to answer seen across all connected inbound calls within the selected period and group. |
Average Call Duration (ACD) | The average call duration of all connected calls (inbound and outbound). |
Leaderboard
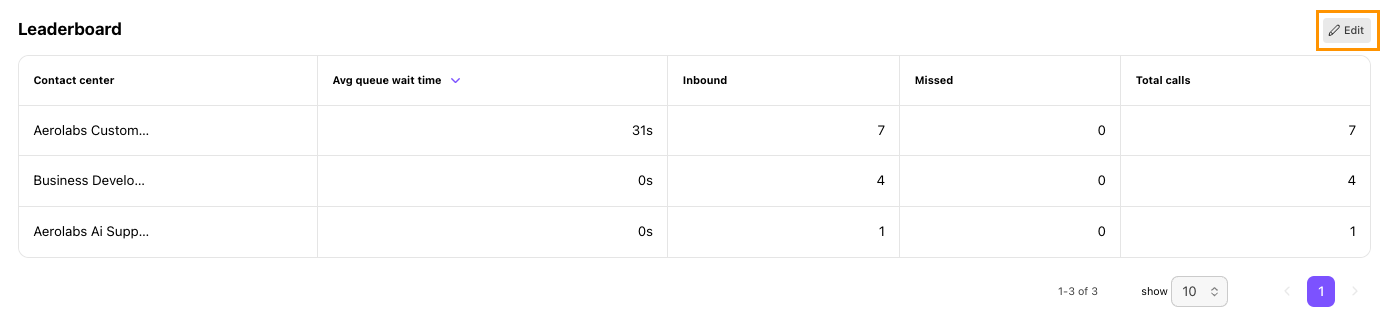
The leaderboard helps you spot which contact centers and groups are hitting targets or dropping the ball. You can see key metrics like their average queue wait time, total calls, calls answered within SLA, and more.
To customize the leaderboard, select Edit, then use the eye icon to hide or show specific metrics. To sort the leaderboard by a particular metric, select the down arrow in that column header.
Frequently asked questions
Can I export the Queue Health Report?
Yes. To export the Queue Health Report, select Export (.csv), then select Send report.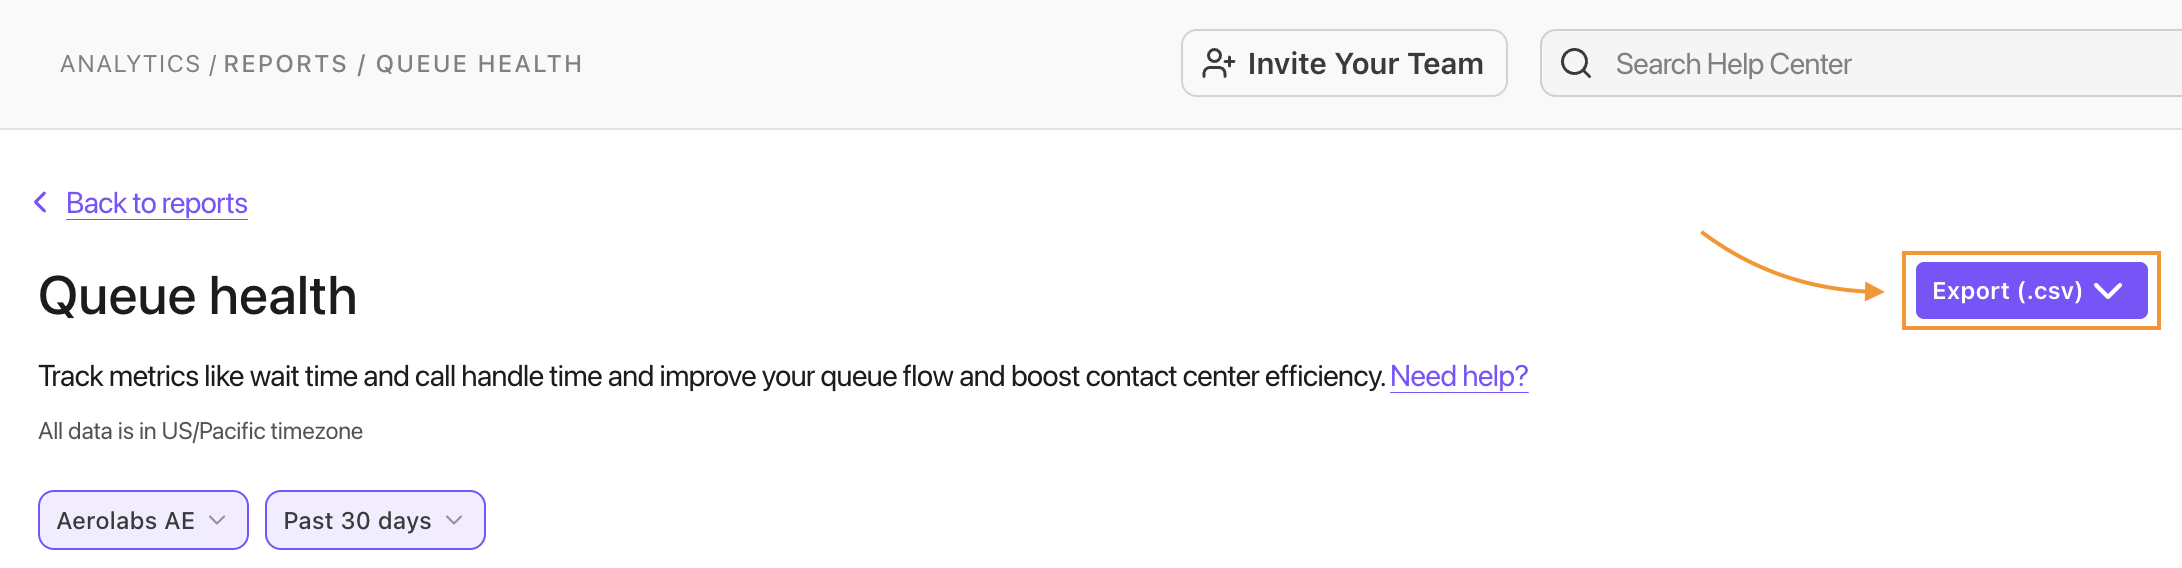
My leaderboard layout looks broken, what should I do?
Reset the report to its default values using the “Modified” button next to the report title. We are aware of this issue and are working on the fix.