The Agent Productivity Report helps you understand how your agents spend their time—so you can spot trends, reduce downtime, and optimize team performance. Whether you're tracking breaks, monitoring occupancy rates, or reviewing productivity percentages, this out-of-the-box report offers clear visibility into key contact center metrics.
Let’s dive into the details.
Who can use this
The Agent Productivity Report supports Voice and Digital Contact Center channels and is available to Contact Center Admins and Supervisors.
Access the Agent Productivity Report
To access the Agent Productivity Report, go to the Dialpad Admin Portal.
Select Analytics > Reports
Select Agent productivity
.png)
Filter by Contact Center(s), timeframe and agent expertise group
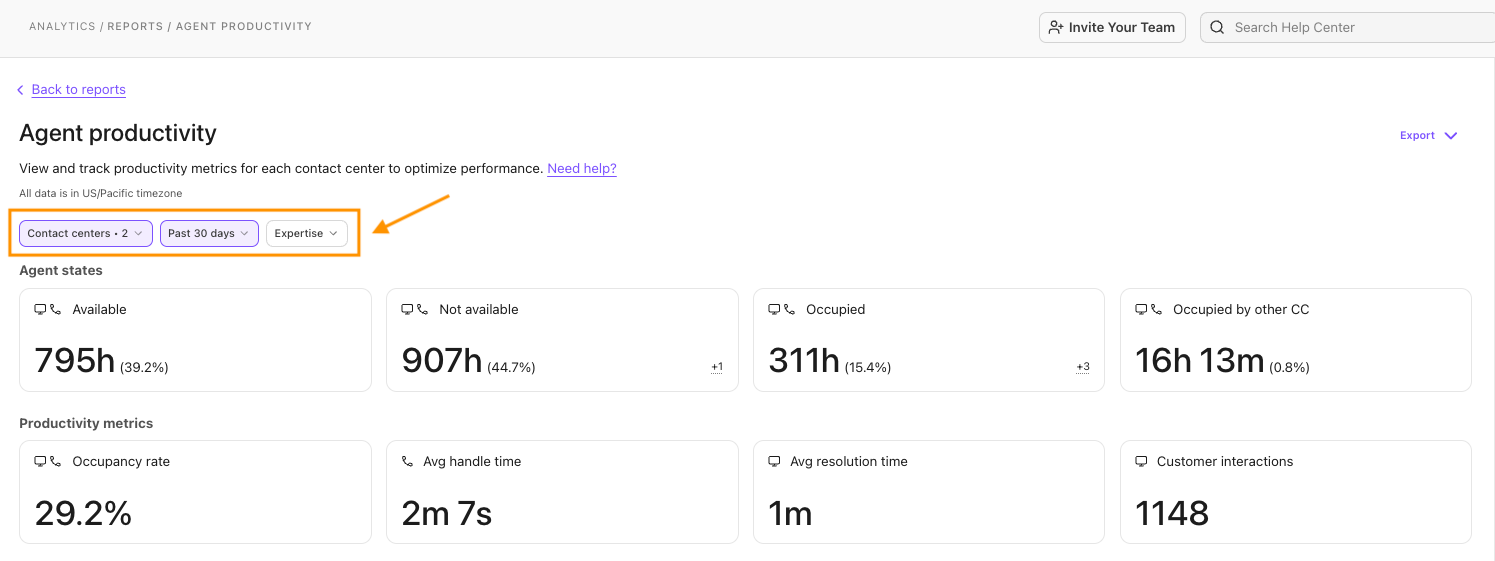
Here, you’ll see aggregated data filtered by your criteria and a leaderboard that provides agent-level insights, including time spent in different states, break patterns, and key productivity metrics.
Agent Productivity Report Dashboard
When filtering your report, the dashboard tiles update accordingly as you select report filters.
Digital and Voice Contact Centers | Digital Contact Centers Only | Voice Contact Centers Only |
Agent states
Productivity
| Agent States
Productivity
| Agent states
Productivity
|
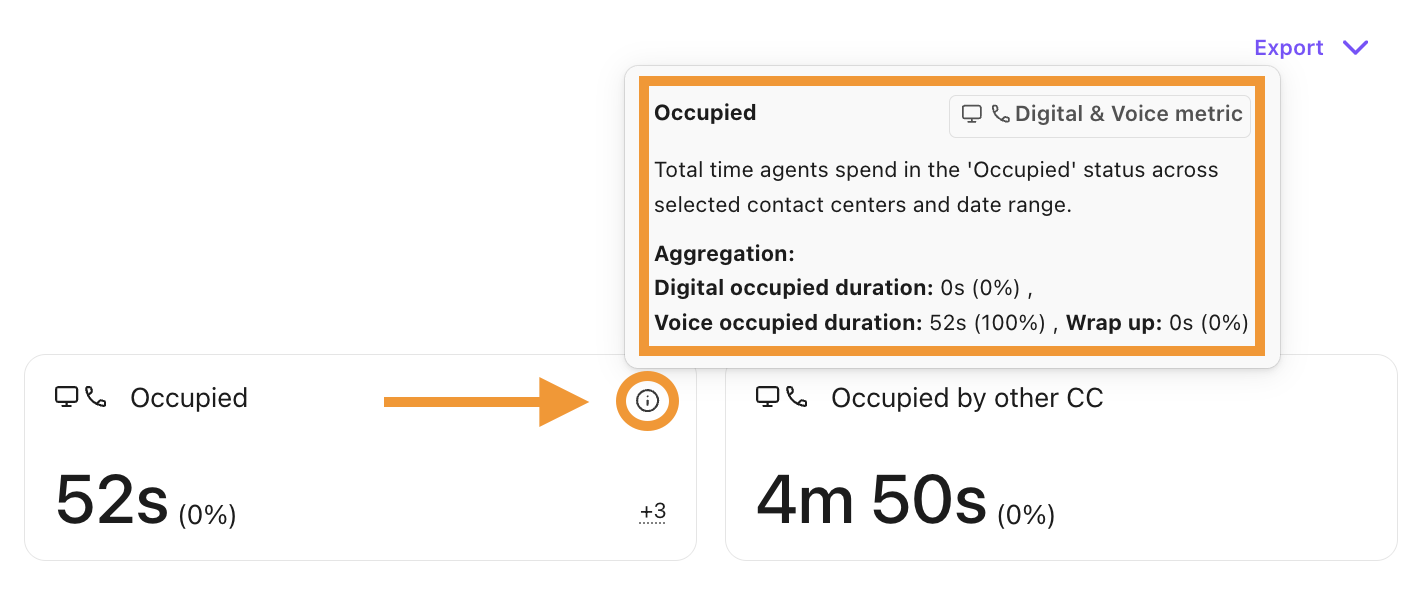
Note
Definitions and formulas are available for each tile by hovering over and selecting the Definition icon.
Agent Productivity Report metrics
The Agent Productivity Report lets you customize your report with unique metrics for digital contact centers, voice contact centers and agent performance.
Metrics for voice contact centers
The Agent Productivity Report offers the following metrics, available only for voice contact centers.
Metric | Definition | Formula |
|---|---|---|
Productivity | The percentage of time that this agent spent in occupied and wrap-up status vs. active login hours. | |
Occupied by other voice CC’s | Total agent handling time in other contact centers (excluding selected). | Occupied by other contact center = 'Occupied' + 'Wrap up' |
Avg handle time | Average time spent handling a call, from ringing to wrap up work. | Average handle time: (total call duration + total wrap-up) / total inbound and outbound connected calls |
Avg Scoreboard | The average scorecard out of the total handled calls by the agent. | |
Avg CSAT | The average CSAT score across all calls handled by the agent. | |
Total Calls | The total number of calls handled by the agent. | |
Inbound answered calls | Total number of inbound calls that were answered. | |
Answered callbacks | Total number of callbacks that were answered. | |
Avg calls / day | The total number of calls handled by the agent out of the total time period. | |
Avg Speed to Answer | The average time to answer a call by the agent. |
Metrics for digital contact centers
The Agent Productivity Report offers the following metrics, available only for digital contact centers.
Metric | Definition | Formula |
|---|---|---|
Customer interactions | The total number of customer sessions (parent sessions) that are handled by the agent. | |
Avg resolution time | Average handling time per customer interaction handled by a human agent. | Average Resolution Time = Total resolution time ÷ Total customer sessions handled by human agent. |
Avg customer interactions | The average number of customer interactions handled by a human agent out of the selected time period. | |
Productivity | The percentage of time the agent spent in digital occupied status vs. active login hours. |
Metrics for voice and digital contact centers
The Agent Productivity Report offers the following metrics for both voice and digital contact centers.
Metric | Definition | Formula |
|---|---|---|
Not available | The total time an agent was marked as 'Unavailable'. | Unavailable Time = Busy Time + Breaks + Missed Calls |
Available | The total time spent in the 'Available' status, in the selected contact centers and date range. | |
Occupancy rate | Total agent occupied time vs. idle time in selected contact center and date range. | Occupancy rate = (Occupied time + wrap up + digital occupied + other contact center occupied) / (Above Total + Idle Time) x 100 |
Unavailable Count | Total number of times an agent is unavailable in the selected time period.
| |
Total Unavailable Time | Total duration of time spent as unavailable.
| |
Avg. Duration/Unavailable | The average amount of time an agent is unavailable.
| |
Avg log in time | The Agent's first activity stamp of the day (can include log in, status change). | |
Avg log out time | Agent's last activity stamp of the day. | |
Wrap up | The total amount of time spent in 'wrap up' within the selected date range and contact center out of the total login time. A percentage is displayed as well. (21m 49s (3.2%)) | |
Avg unavailable time / day | The average time the agent is unavailable per day within the selected date range. |
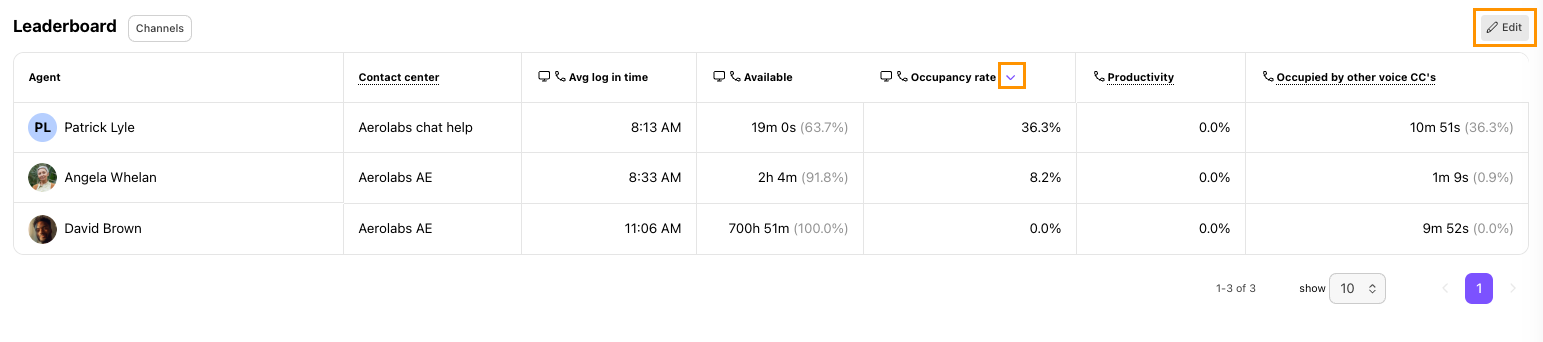
Agent leaderboard
The agent leaderboard helps you spot top performers and understand how agents spend their time. You can view key metrics, including total interactions handled, time spent in an available state, and other relevant data. Refer to the Agent Productivity Report Metrics for all available metrics.
To customize the leaderboard, select Edit, then use the eye icon to hide or show specific metrics. To sort the leaderboard by a particular metric, select the down arrow in that column header.
Frequently asked questions
How do average formulas work?
Average formulas reflect only the days where the breaks/chats/calls happened.
How is break time calculated?
Break time is the amount of time spent in any custom off-duty status.
Why don’t my aggregate percentages always equal 100%?
Due to slight rounding errors, you might notice the total of available, unavailable and occupied will be 99.7% and not 100%.
Why did my group filter selection change?
If you navigate away from your report and return, you’ll need to reset the group filter.
If a call is transferred, does it count as one interaction or two?
At the Contact Center level, each customer interaction is counted once—even if it was transferred between agents.
At the agent level, total interactions may appear higher because each agent involved in a transferred conversation is credited with one interaction.
Can I export the Agent Productivity Report?
Yes. To export the Agent Productivity Report, select Export and choose if you want to send the report immediately, or schedule it for later. 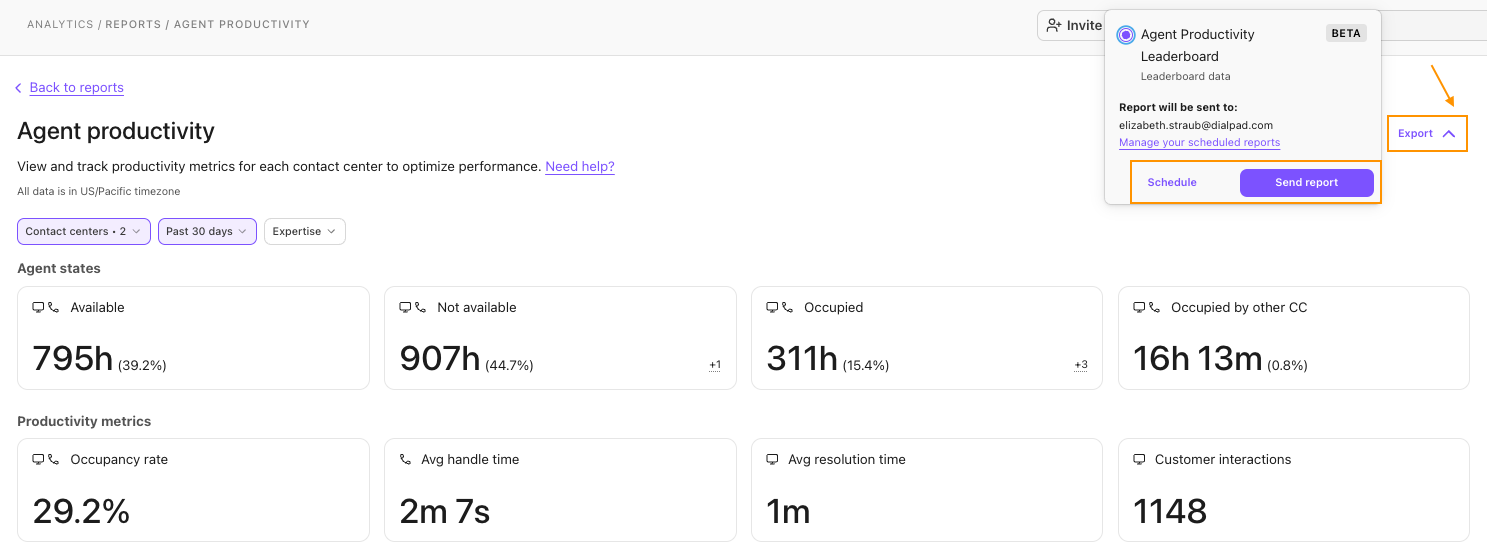
Note
When you export the Agent Productivity Report, only the filtered leaderboard data will be exported.
Can I view my agent’s time in or out adherence from this report?
No, to track and view an agents adherence report, you’ll need to purchase the WFM add on and access that from within Dialpad WFM. You’ll be able to view the drivers behind adherence in terms of agent status and activity, in real-time and to minute level granularity.