Analytics and Call History menus reveal a lot about overall performance, but Contact Centers in Dialpad can take advantage of deeper metrics that gather insight from every conversation.
Let's take a look at the metrics organized for a Contact Center.
Who can use this
Contact Center analytics are available to Dialpad Support and Dialpad Sell users.
To access analytics, you must also be a Contact Center Admin or Supervisor, or be granted analytics permissions.
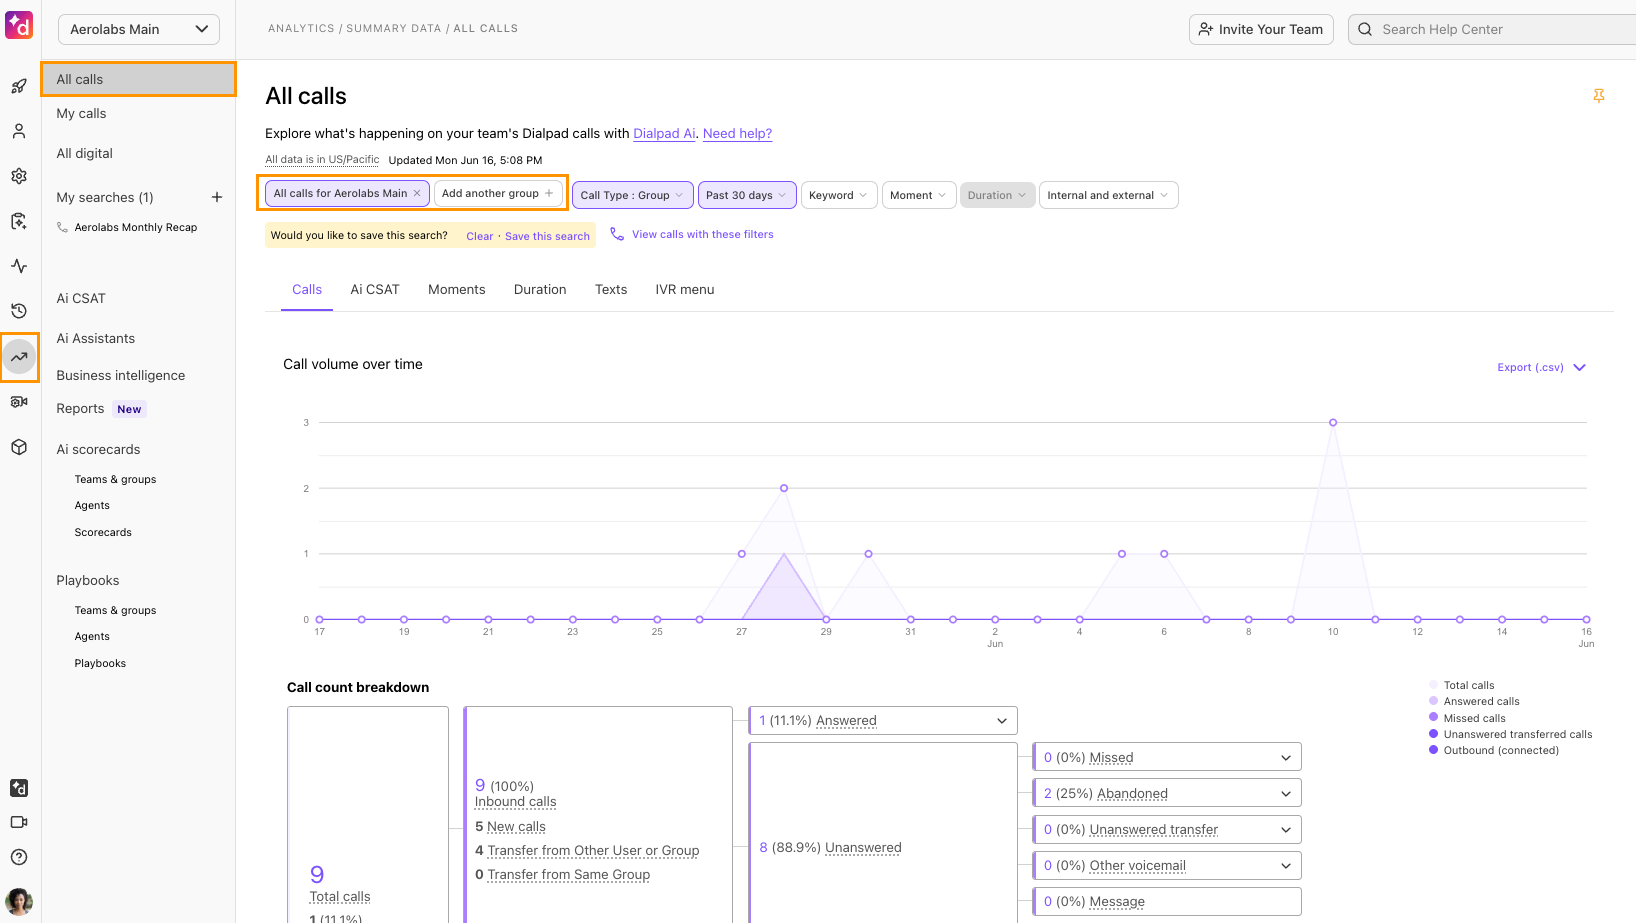
Access Contact Center analytics
To access your Contact Center analytics, go to your Dialpad Admin Portal.
Select Analytics
Select All calls
Select a Contact Center
Note
Only Admins or Supervisors can access the Contact Center Analytics, and no keyword or moment filter should be used.
Available metrics
Dialpad's out-of-the-box analytics displays the following metrics.
Metric | Included Statistics |
|---|---|
Calls |
|
Moments |
|
Unanswered |
|
Service Level |
|
Duration |
You can export this data to a CSV file by selecting Export at the top-left of the chart and select the report type you need. |
Texts |
|
Queue |
|
Agent Status |
You can export this data to a CSV file by selecting Export at the top-left of the chart and select the report type you need. |
Heatmaps (Weekly Averages) |
|
Concurrent Calls |
|
AI CSAT |
Customers with the AI CSAT Add-on will additionally see AI CSAT predictions along with their customer responses |
Dispositions |
You can export this data to a CSV file by selecting Export at the top-left of the chart. |
IVR Menu |
|
Alerts by day
Under the Calls tab, navigate to Alerts by day to see the trends for Contact Center-based alerts including service level, wait time, queue size, no agents and agents off duty metrics.
.png)
Recommendations by day
Under the Calls tab, navigate to Recommendations by day to see trends for real-time assist cards that were triggered during agents' calls. This will give you insights into how often these cards are being used and their overall effectiveness during calls.
Note
The Alerts and Recommendations by day won't appear if you include today's date or if you select multiple Contact Centers in the filter.
Leaderboards
Dialpad offers 3 different Contact Center Leaderboards, letting you gain insights on your top performers, most used numbers and AI recommendations.
Use the up and down arrows to sort the leaderboard by column, or even hide certain metrics if they don't matter do you.
Note
This view is limited to the top 100 agents for any metric you're sorting by. Numbers of calls is set by default.
Let's look at each leaderboard.
Agent calls leaderboard
The Agent calls leaderboard provides a clear overview of an agent performances, tracking an agent's number of calls, total call minutes, average call duration, answer time, outbound calls made, inbound calls answered, missed calls, and canceled calls.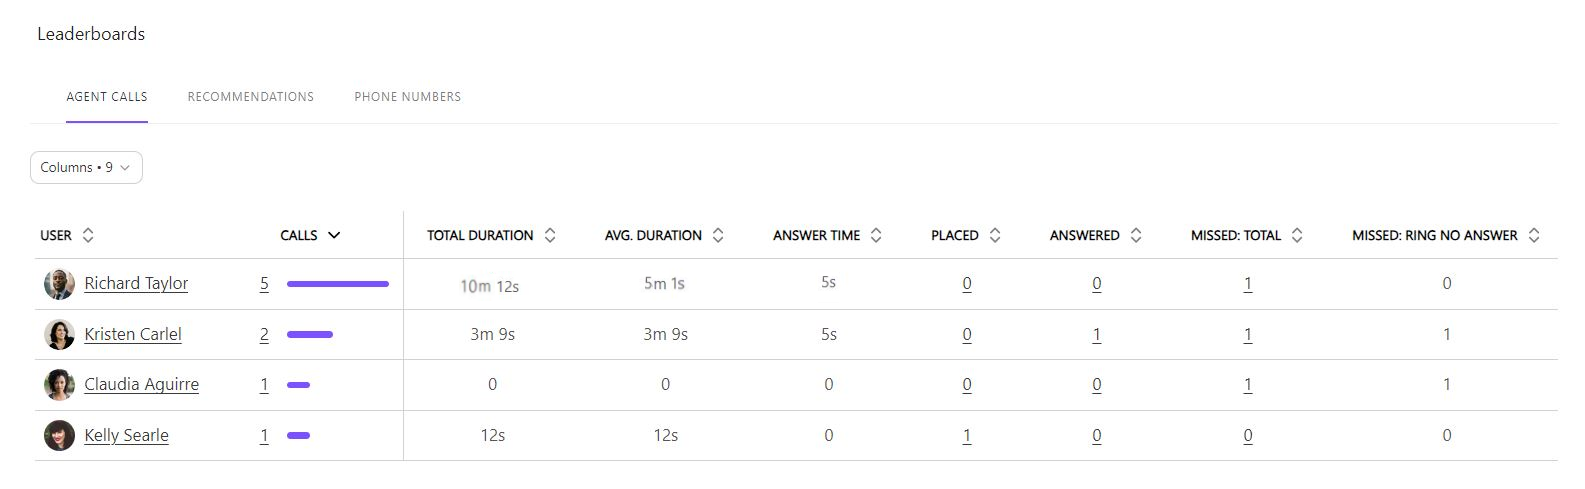
Recommendations
The Recommendations leaderboard tracks the usage of each Real-Time Assist Card, along with its helpfulness ratings.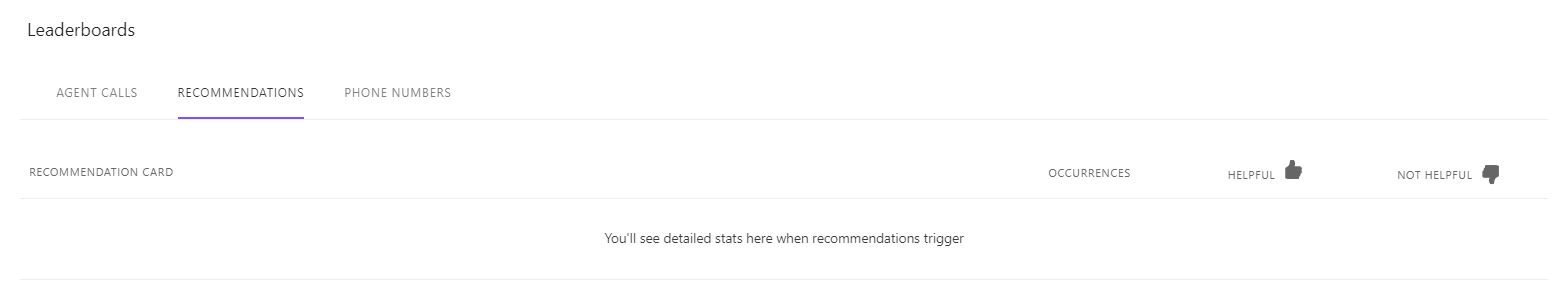
Phone numbers
The Phone numbers leaderboard tracks metrics like total calls, call minutes, average call duration, outbound calls, answered inbound calls, missed calls, and canceled calls.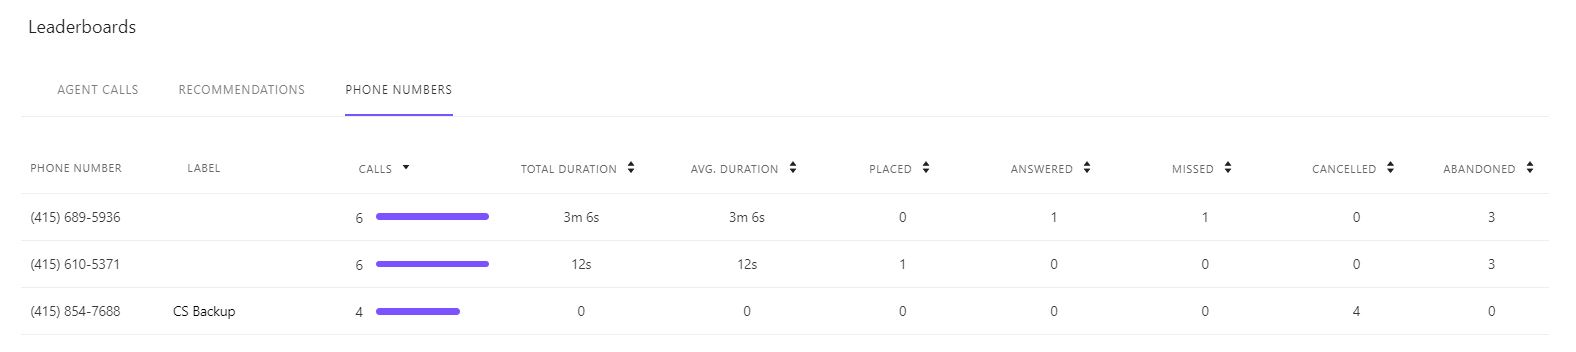
Note
The Phone numbers leaderboard is only applicable if your Contact Center has more than one phone number assigned.
Heatmaps
More than just a dashboard, heatmaps provide a clear visual of call volume patterns and answer times, letting contact center managers can see which days of the week are busier than others and schedule the workforce accordingly.
Darker colors on the heatmap indicate higher call volumes or longer answer times for that time period. To view detailed information, hover over a cell in the heatmap.
If you want more data, select Show Exact Values to view the number of calls or answer time at all times. 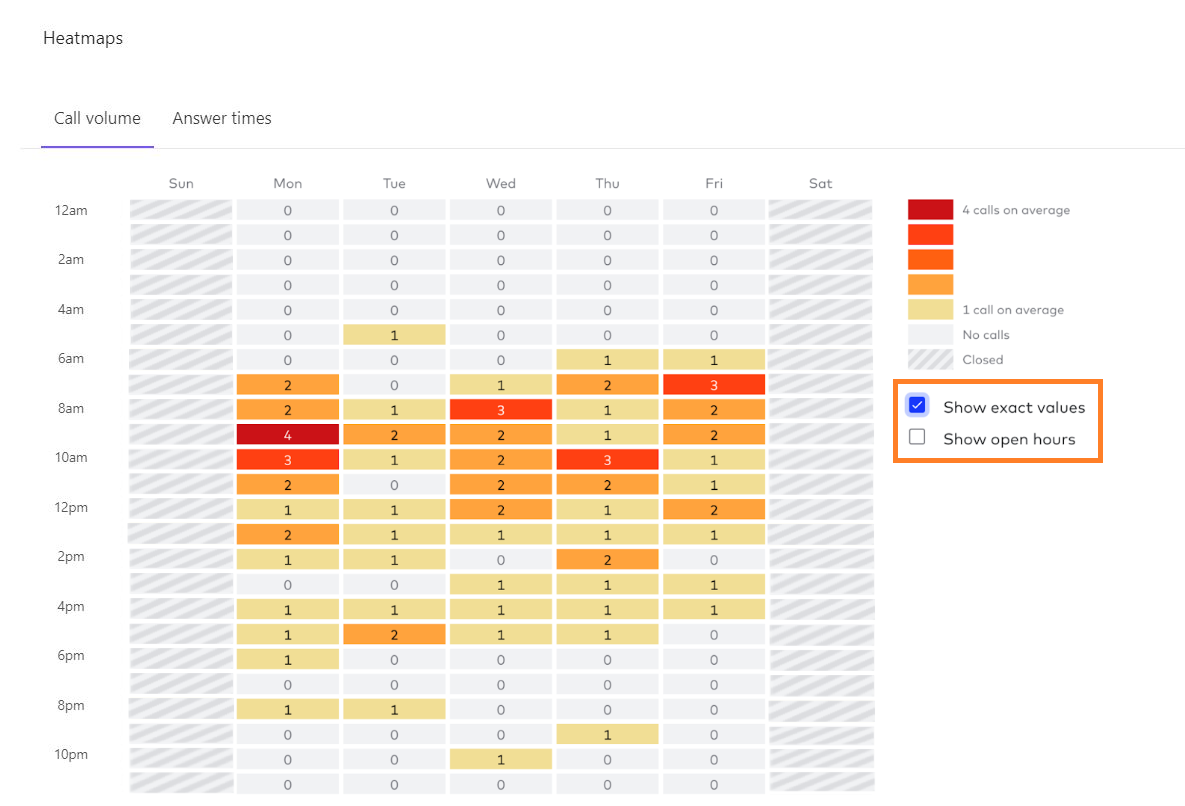
You can also customize your heatmap by only displaying information during your line's open hours. .png)
Dialpad offers 2 different types of heatmaps, lets look at each one.
Note
Heatmaps are only available for Contact Centers and do not include greetings or menus.
Call volume heatmap
The Call volume heatmap indicates the number of calls reaching the Contact Center during a period of time..png)
Answer times
The Answer times heatmaps shows how long callers wait in the queue before an agent answered their call during a specific period, excluding time spent on greetings or in the IVR menu..png)
Note
When you filter by a specific day or week, you'll see data for that exact period of time. However, if you filter by an entire month, Dialpad will show the average data across all days of the week.
Concurrent calls
The Concurrent calls tab shows how many calls are happening at the same time. Contact Center managers can use this information to plan agent schedules and get ready for future simultaneous calls, helping to reduce long wait times.
.png)
It will display average and maximum concurrent calls for each day of the week.
IVR Menu
In the IVR Menu tab, analyze the use of IVR menus in a Department or Contact Center. You'll see IVR menu options, usage count, and usage percentage..png)
Change your IVR menu configuration? IVR menu options will still appear in the IVR Menu tab for analytical purposes whether any options were changed or disabled.
Learn more about Dialpad's Contact Center analytics here.