Analytics tell you a lot about your business, and Dialpad's Analytics menu organizes data into an easy-to-understand format to quickly gain insight.
Let’s dive into the details.
Who can use this
Company Admins can access analytics for all Offices, Departments, and individual team members in their company. Office Admins can access analytics for their Office, Departments, and individual team members they are the admin of.
Department Admins and/or Contact Center Admins can access analytics for departments and/or contact centers they are the admin of.
Individual team members can access analytics for their own personal calls and messages. They can only access company-wide analytics if granted permission by their account admins.
Access analytics
To access your Dialpad analytics, go to the Admin Portal and select Analytics (the trendline icon in the sidebar).
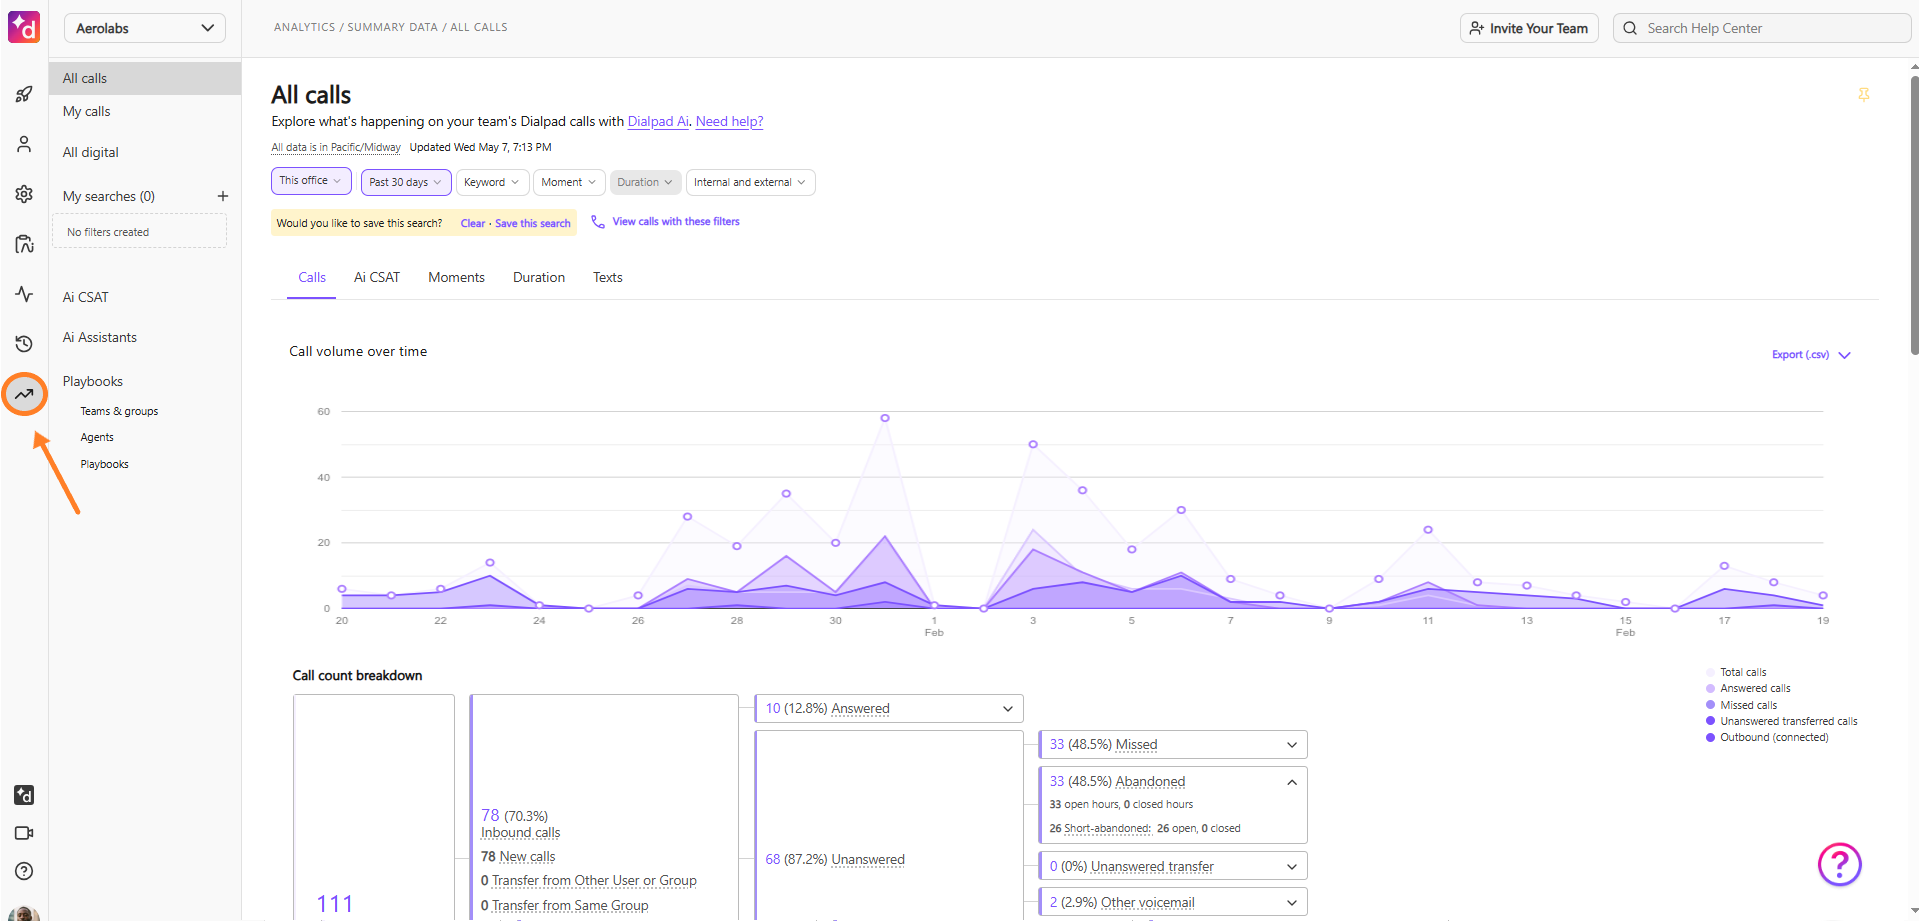
From here, you can filter, save, or export your data.
Set a default analytics view
Select the Pin icon in the top-right corner to set your default view that displays each time you visit the Analytics page.
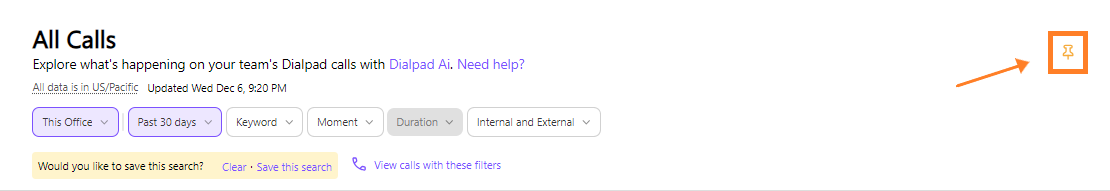
Note
Set your default view as All calls, My calls, or a saved search.
Once you've set a default view, the pin turns yellow to indicate that you’re viewing your default view.
Multi-target filter
Multi-target filters allow you to obtain granular information about your individual performance, your team's performance, or even your entire company's.
By default, if you’re an Office or Company Admin, when you first view your analytics, it will be filtered to All calls for Entire Office. If you’re an individual team member, you will only see your own data.
To update your analytics view:
Select This Office filter
Select a User or Group from the drop-down menu
Filter by call type
Call type: Users
Displays calls made and received by the selected users, including calls to their personal line, and all other Departments and Contact Centers they are a member of. This can be filtered further by any group they belong to.
Call type: Groups
Displays calls made and received in the filtered group(s).
Select Add another user or Add another group to enter another target of the same type
Once a filter has been applied, add additional targets to the filter.

Note
Only Departments and Contact Centers can be mixed. You cannot search for a Department and Coaching Team.
Restrictions include:
Multiple Departments, Contact Centers, or Main Line
Multiple Coaching Teams
Multiple users (+/-group)
Single office or company
Additional filters
In addition to our multi-target filters, Dialpad offers these additional filters.
Date Ranges | Filter based on specific time periods.
|
Duration | Filter based on the call length. |
Call Content | Filter based on AI features
With any call content filter, you'll need to have AI enabled.
|
Labels | Filters the call by the shared line's label.
|
Internal/External | Filter the calls tab to drill into internal or external call data.
|
Notes
Preset range selections automatically fill the start and end date. For example, selecting "Past 30 Days" on April 1 will display data from March 1 to April 1.
Important: This is not a rolling filter. If you revisit the same URL the next day (April 2), the preset dates remain unchanged—you’ll still see data from March 1 to April 1, not April 2.
To refresh your data, reset your filters.
Preset range selections starting with "Past" will include today's data with the historical data.
Saved search for filters
Easily return to frequently used filters by saving your search.
To save a search:
Select the desired filter(s)
Select Save this search
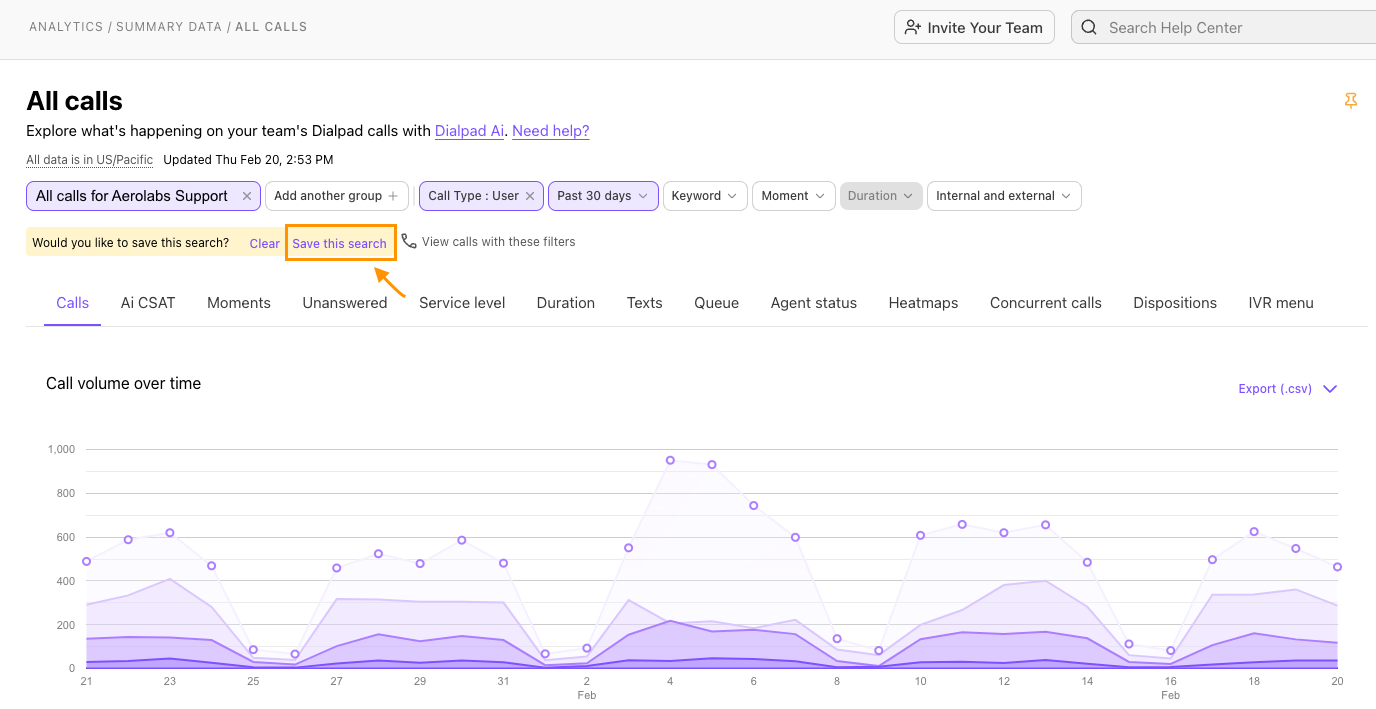
Name the search
Select Save this search
Tip
Saved searches can be bookmarked, allowing you to save the URL and quickly return to the exact filtered view whenever you need it.
To delete a saved search, open it and select the Trash icon in the top-right corner. Saved search also offers edit and reset options if you decide to make any changes.
Keep in mind your saved searches in the analytics section do not carry over to the call history page.
Analytics categories
Dialpad provides many different visualizations on key topics, allowing you to stay on top of your contact center and agent's performance.
Easily switch view the different data by clicking between section categories. Dialpad offers out-of-the-box reporting on these categories:
Calls
AI CSAT (if added to your plan)
Unanswered
Service level
Duration
Texts
Queue
Agent status
Heatmaps
Concurrent calls
Disposition
IVR menu
Alerts by day
Recommendations by day
Let's go over each category.
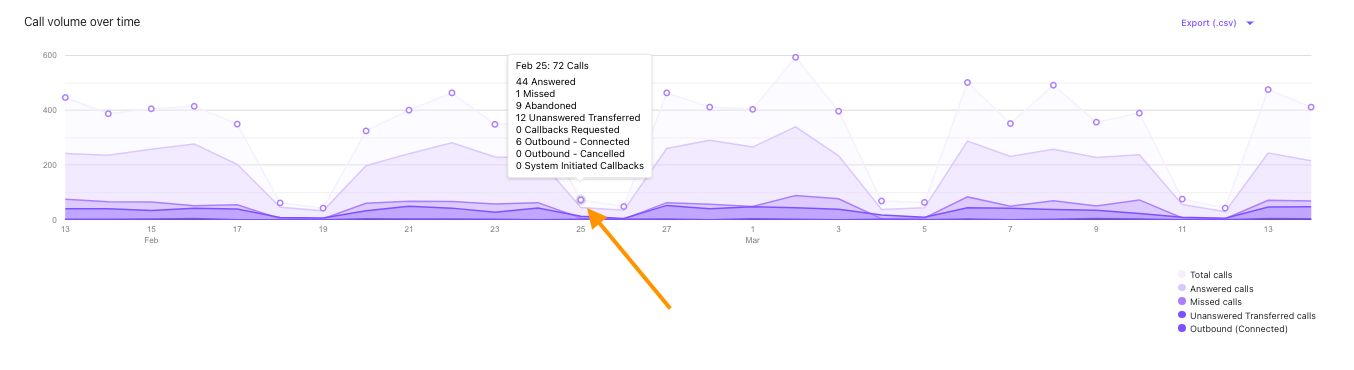
Calls
The Calls tab provides a graph of your call volume over time. Select a day to open a detailed overview of the call events for that day.
Below the Call volume over time chart, you'll see the Call Count Breakdown.
The Call count breakdown displays an overview of call types and activities during the timeframe set in your filter.
Select the arrow beside each target activity to expand the content. 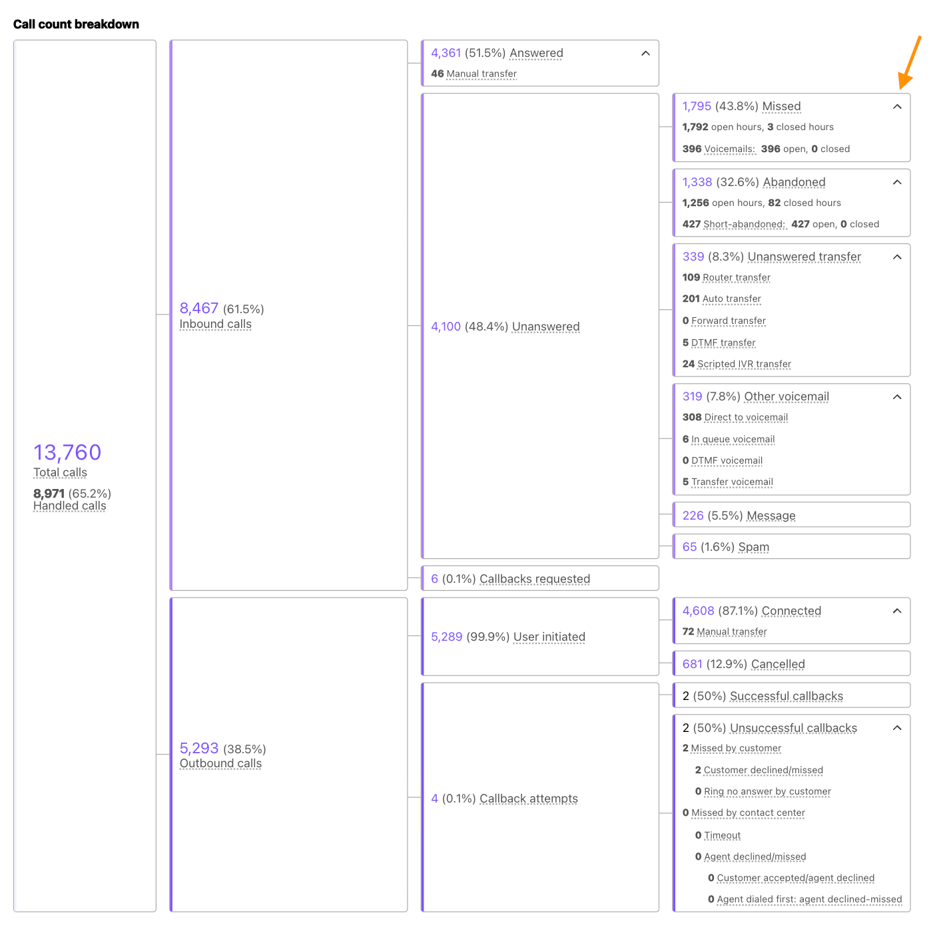
If you have not filtered for specific keywords or moments, the Calls tab data displays granular data on the total number of calls. More than just being able to view the total number of inbound and outbound calls, you can also quickly reference the following:
Total number of Answered Calls
Total number of Unanswered Calls
Total Number of Callbacks Requested
Total Number of Calls Initiated by a Dialpad User
Total Number of Callbacks
Each of these sections is further broken down into:
Total Number of Missed Calls
Total Number of Abandoned Calls
Total Number of Unanswered Transferred Calls
Total Number of Other Voicemails
Total Number of Messages
Total Number of Spam Calls
Total Number of Connected Calls
Total Number of Cancelled Calls
Hover over each item to see the target's definition, and be sure to review our Analytics Glossary.
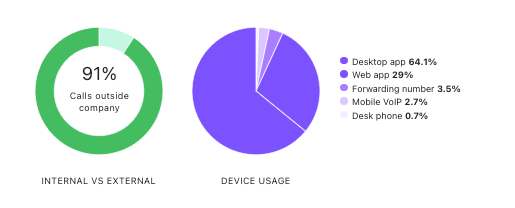
Calling habits
Calling Habits allow you to learn the how and the who of your team's calling behavior.
The Calling habits pie charts are located below the recommendations by day section on the Calls tab.
Note
Calling Habits are only visible when an admin is looking at an entire Office's analytics, not a single Department or Contact Center.
Here's where you can get a general sense of how calls are placed/received throughout your office.
These stats include:
% of Calls Internal vs External (calls outside the company)
% of Device Usage (web app, desktop app, mobile VoIP, etc.)
(Device usage statistics will only reflect calls made directly to/from individual users, and not calls made to/from groups like contact centers, departments, or offices)
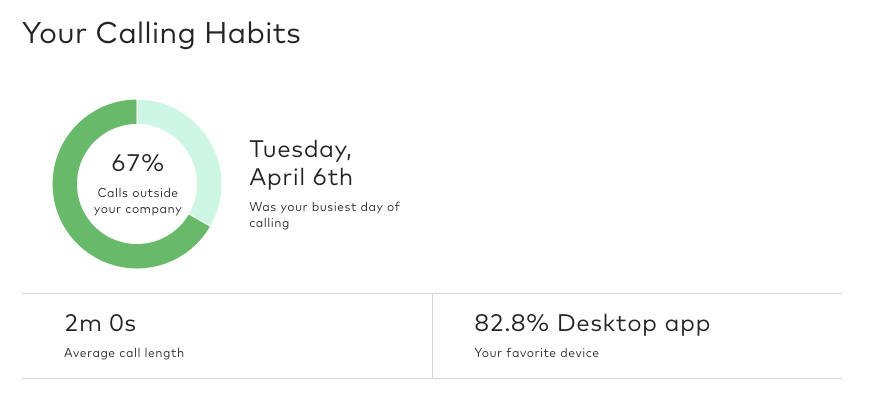
Additional call habit metrics are available to individual team members only or when an admin is looking at their personal analytics, including your average call length, and the busiest day of calling.
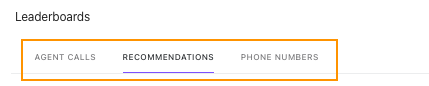
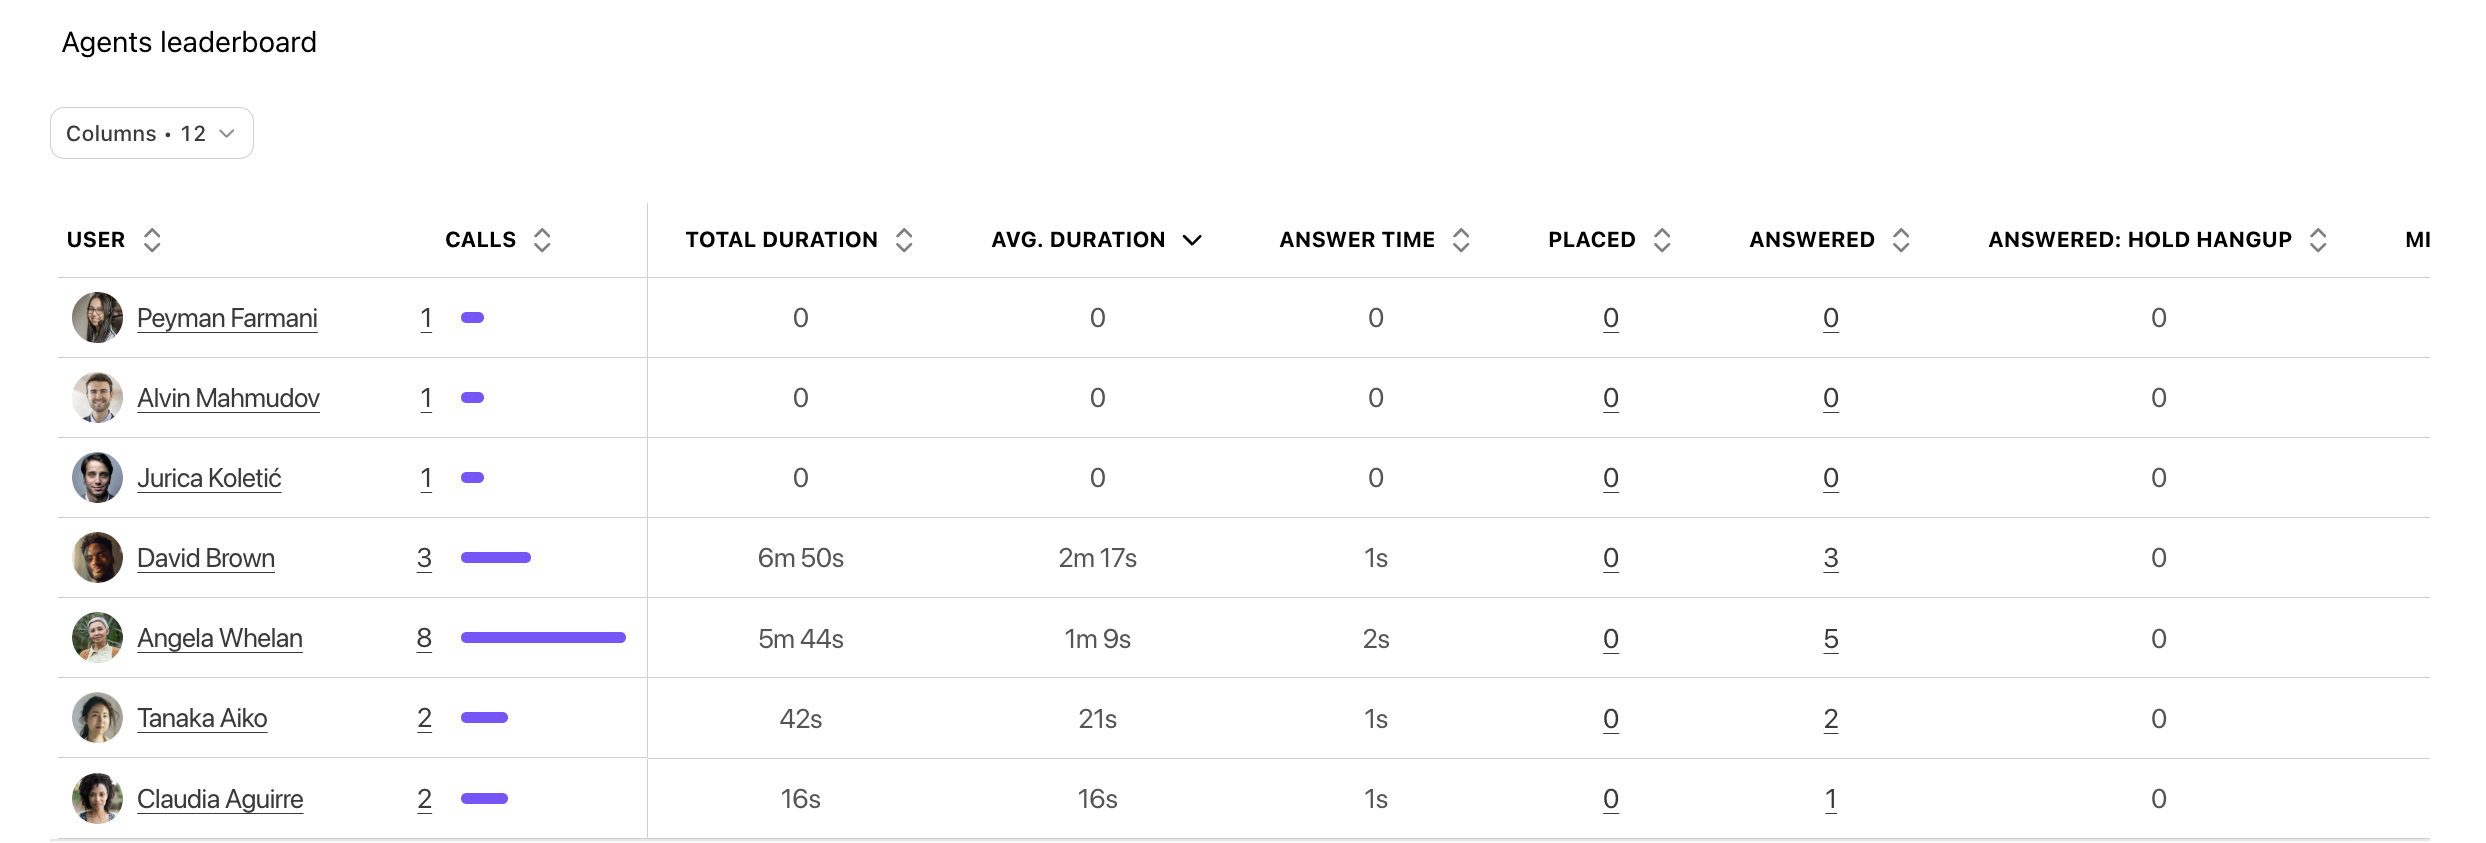
Leaderboards
Admins are able to easily monitor agent call volumes, number trends, and recommendation use with Dialpad's leaderboard feature.
Note
The Agent leaderboard displays when you are looking at an entire Office's analytics, not a single Department's.
On the Calls tab, navigate to the very bottom of the page to find three different leaderboards:
Agent calls
Recommendations
Phone numbers
Navigate between the three by selecting the name from the top.
The Agent Calls Leaderboard displays the total number of calls the agent incurred, broken down into the following totals:
Total duration
Average duration
Answer time
Placed
Answered
Missed
Filter the columns to display only the data you need.
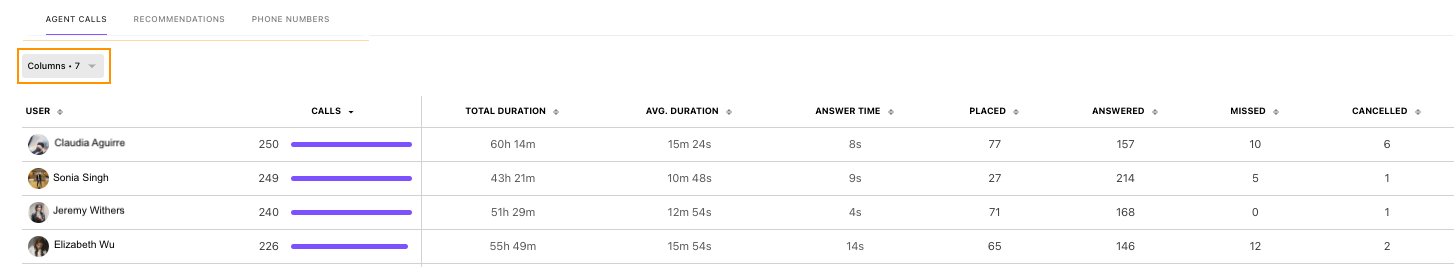
If you need to review individual team members' metrics, select a name on the agent calls leaderboard to open a new view of their personal performance.
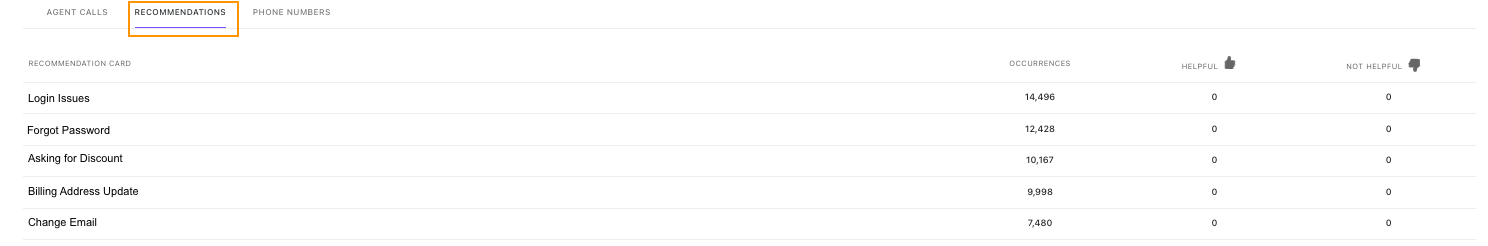
The Recommendations Leaderboard displays the most used AI Live Coach Cards, and the card's CSAT (as rated thumbs up or thumbs down by the agent).
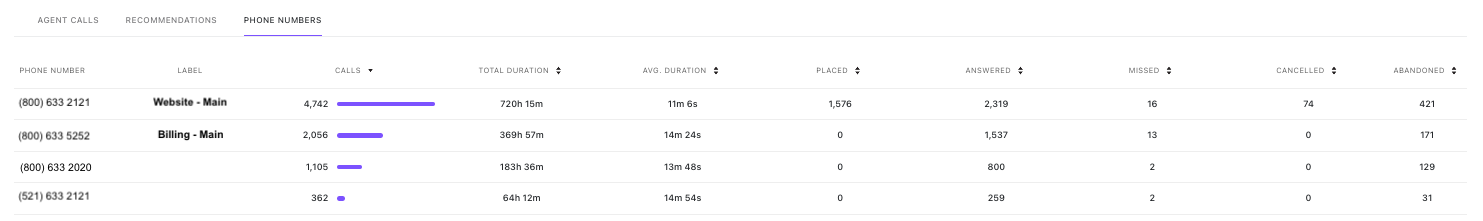
The Phone Numbers Leaderboard provides insight into the performance of your shared lines (ie main line, contact center or department).
Easily review how often calls were placed, missed, and received on each line. You can also compare each line's total and average call duration.
Note
If you're looking for specific Contact Center analytics read this Help Center article.
AI CSAT
The AI CSAT tab allows you to stay on top of the customer experience by monitoring your customer satisfaction survey results and AI predictions.
Note
In order to see this tab, you must have AI CSAT enabled.
Quickly view your overall AI CSAT score and response rate, as well as weekly and 30-day trends.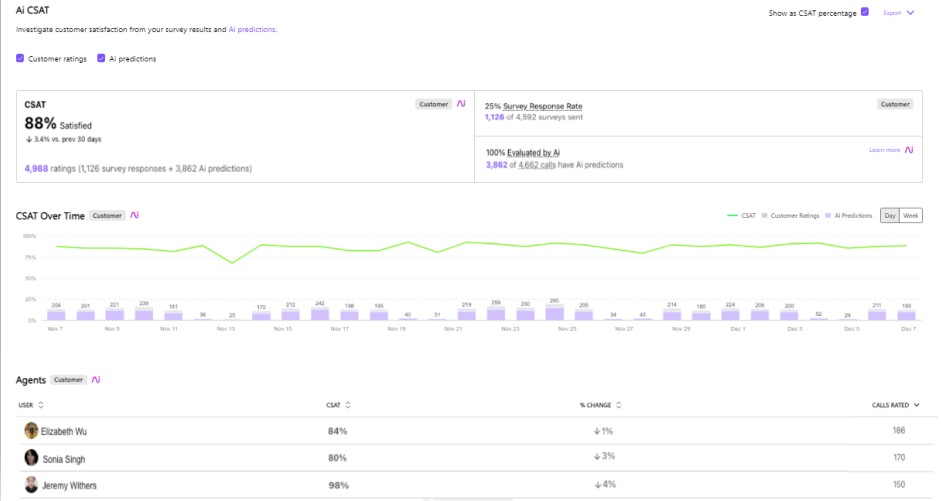
Monitor agent performance by checking their CSAT score, the CSAT variance over the selected time period, and the number of their calls that were rated.
Moments
The Moments tab displays an overview of your Custom Moments usage over time.
If you have not searched for a specific moment, this tab will show the top moments (by their occurrence count) within the sample of calls you’ve filtered for.
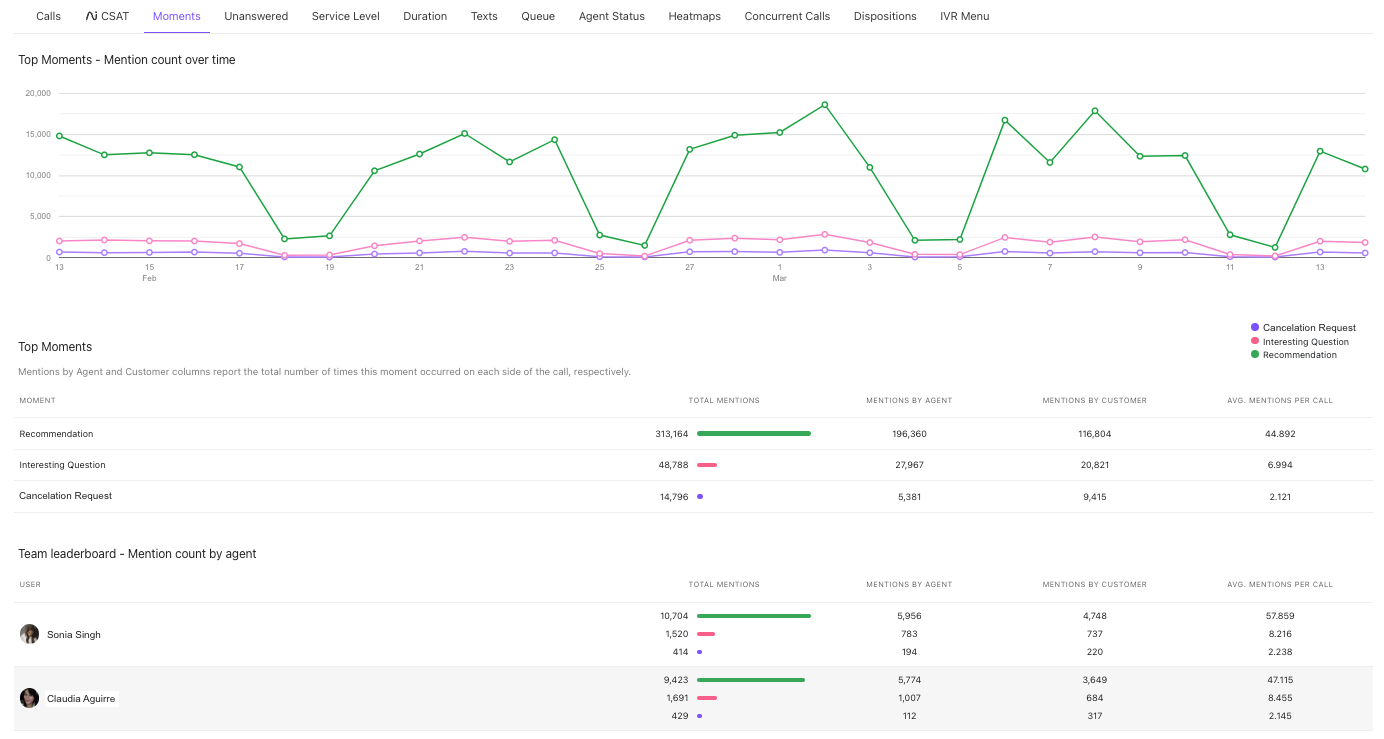
Admins can review the moments’ occurrence trends plotted over time, as well as an agent leaderboard with occurrence counts of the top moments.
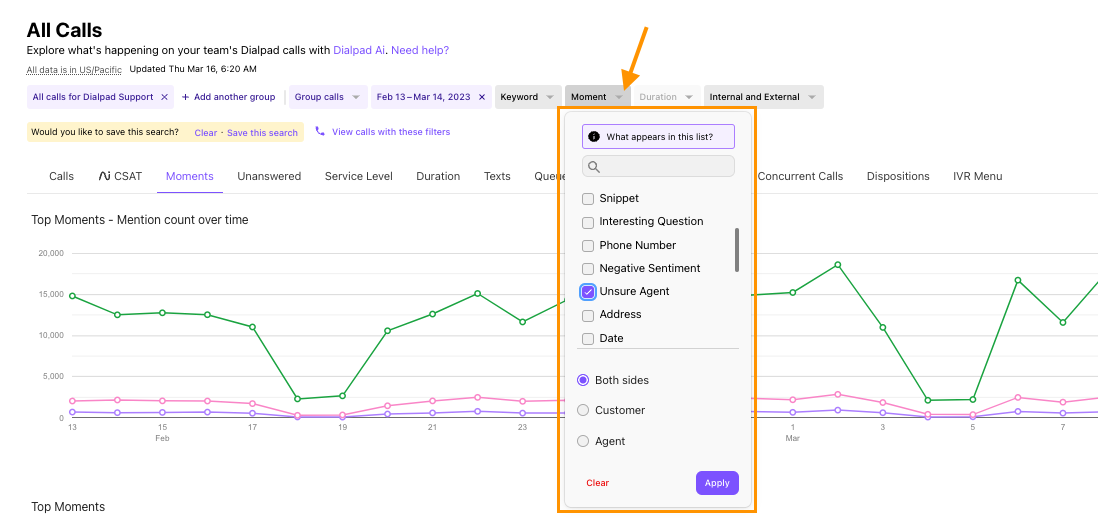
Search for a specific moment (or 3), by using the moment filter.
Select the box beside the moments you'd like to review and select if you'd like to see data on where the moment was used (ie on the agent side, customer side, or both).
Note
On March 11, 2025, we updated the Moments filter across all Analytics reports/pages, changing its behavior from AND to OR for a more intuitive experience.
Now, when adding multiple custom moments, you can filter by any of them instead of requiring all conditions to be met. This update occurred on the backend, so no action is needed on your part. The new behavior allows for broader, more flexible filtering, ensuring you see results for any selected moment at once.
If you'd like to retain the legacy filter behavior (filtering by AND), please contact Customer Care, and we’ll update it for you.
Unanswered
The Unanswered tab provides insight into the number of unanswered calls over time.
Each day displays the total number of voicemails, missed calls, abandoned calls, short-abandoned calls, and unanswered transferred calls. Select on the bar graph to see the total number of calls compared to the total number of unanswered call types.
Below the graph, an agent leaderboard highlights each team member's total number of missed calls (as well as how they were missed). 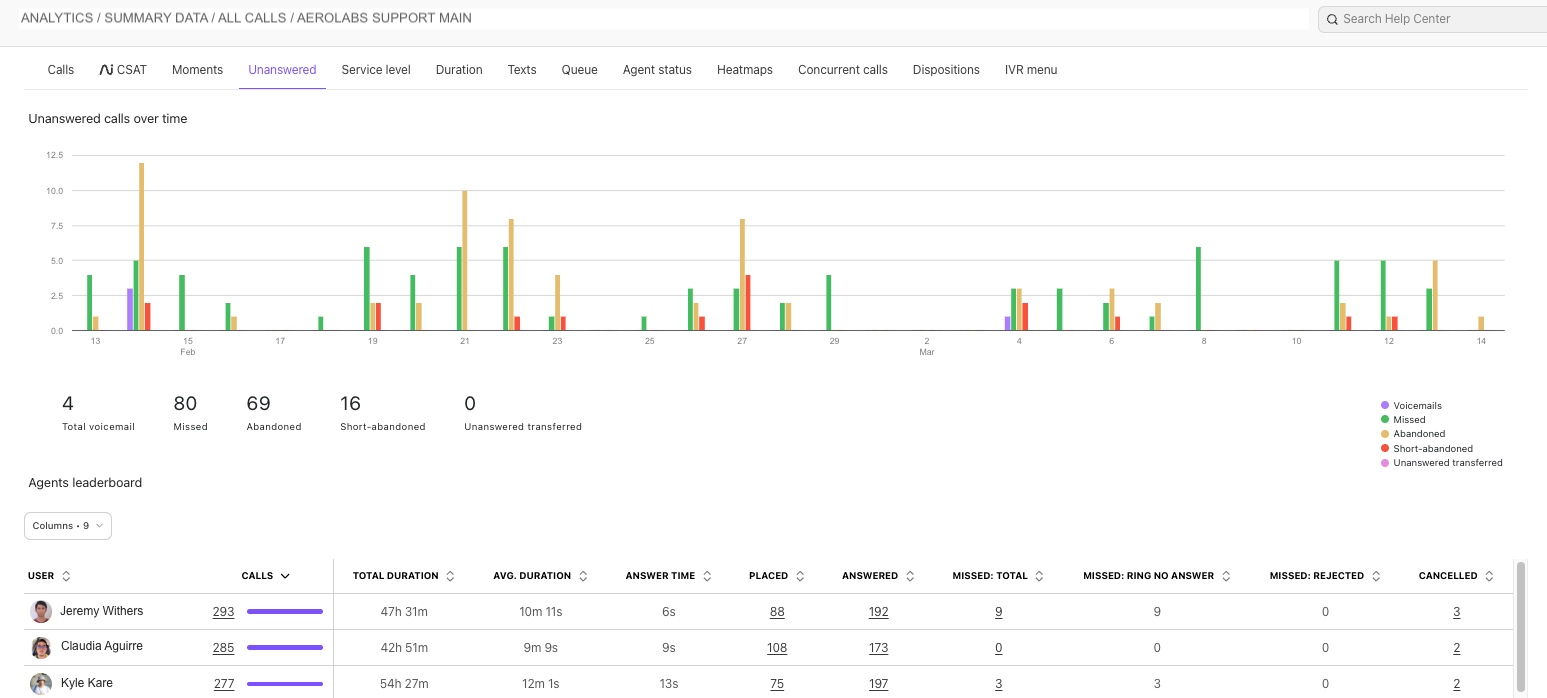
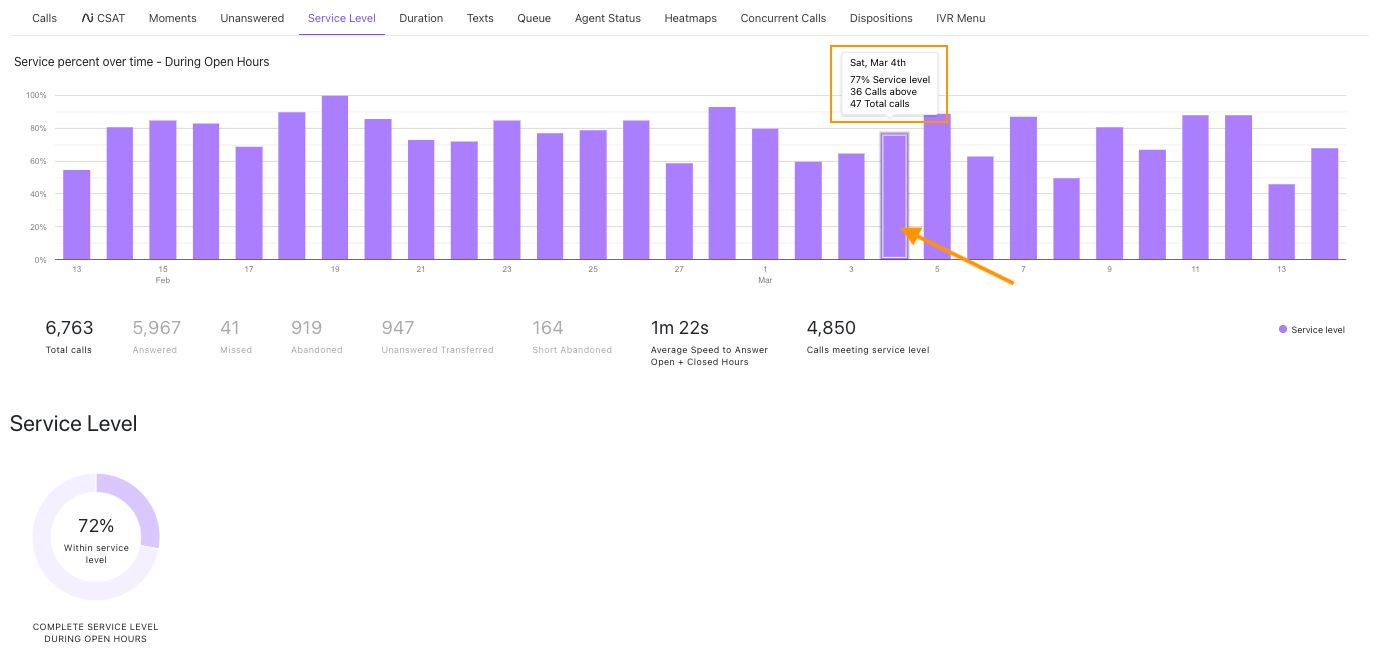
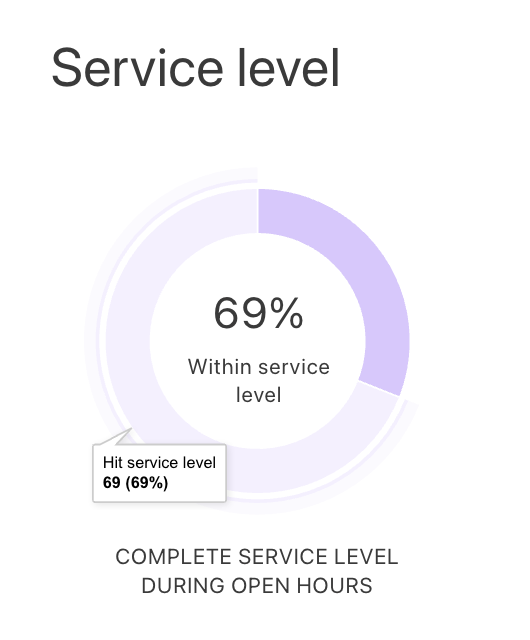
Service level
The Service level tab displays your service level percentage over time, during your open hours.
Select a day to see the average service level for the day, as well as the total number of calls, and the number of calls above your service level. Easily reference the average speed to answer for both open and closed hours.
Below the daily overview graph, there’s a complete service level chart for the filtered time frame.
Duration
The Duration tab provides you with information on call duration, the amount of time that a call is connected to an agent (also known as talk time).
Select a date on the Call duration over time graph to see a detailed breakdown of the total call duration (inbound and outbound), total inbound call duration, and total outbound call duration.
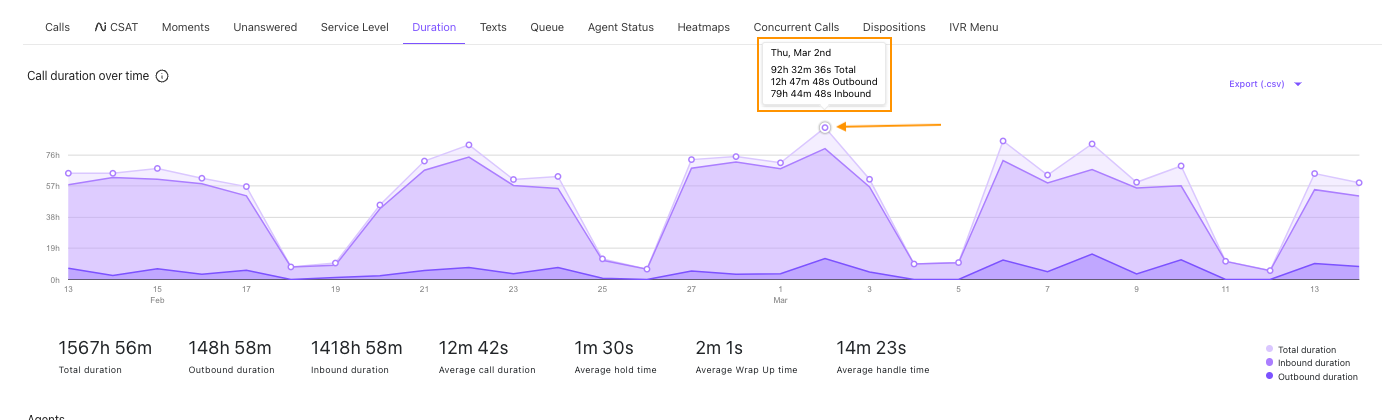
Below the graph, the call duration totals and averages for the filtered timeframe are displayed.
You can reference the average hold time, average handle time, and average wrap up time from the same tab.
Texts
The Texts tab displays the total volume of text messages sent over the filtered timeframe.
Select a date on the Text volume over time graph to see the total number of texts, and the number of internal (messages sent to Dialpad team members) and external messages (messages sent to a non-Dialpad number).
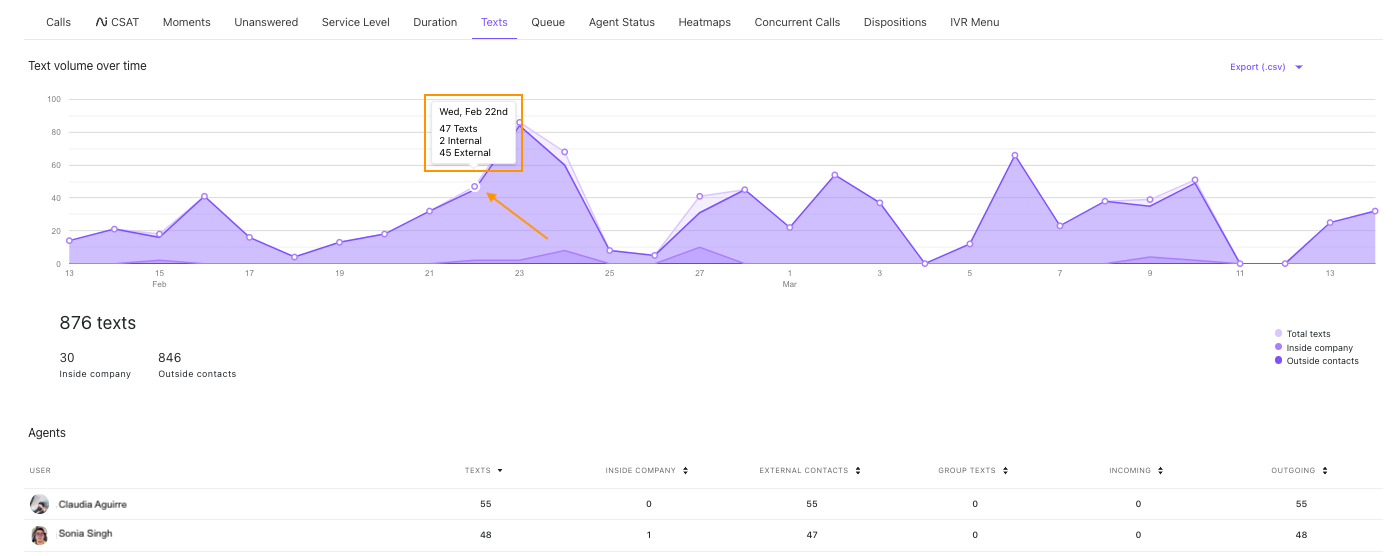
Below the overview, you'll see a per-agent breakdown displaying:
Total number of Inbound messages (ie received messages)
Total number of Outbound messages (ie sent messages)
Total number of group messages
Total number of messages sent internally
Total number of messages sent externally
Total number of delivered messages
Total number of undelivered messages
Total number of failed messages
Total number of messages with an unknown delivery status
Queue
The Queue tab displays the amount of time callers were on hold in the system, the service level completed by agents, and a leaderboard displaying agent metrics on their calls.
On hold wait over time
Metrics about caller hold times over a defined time period help identify trends in caller hold times. Select a bar in the chart to display call hold metrics for a particular day.
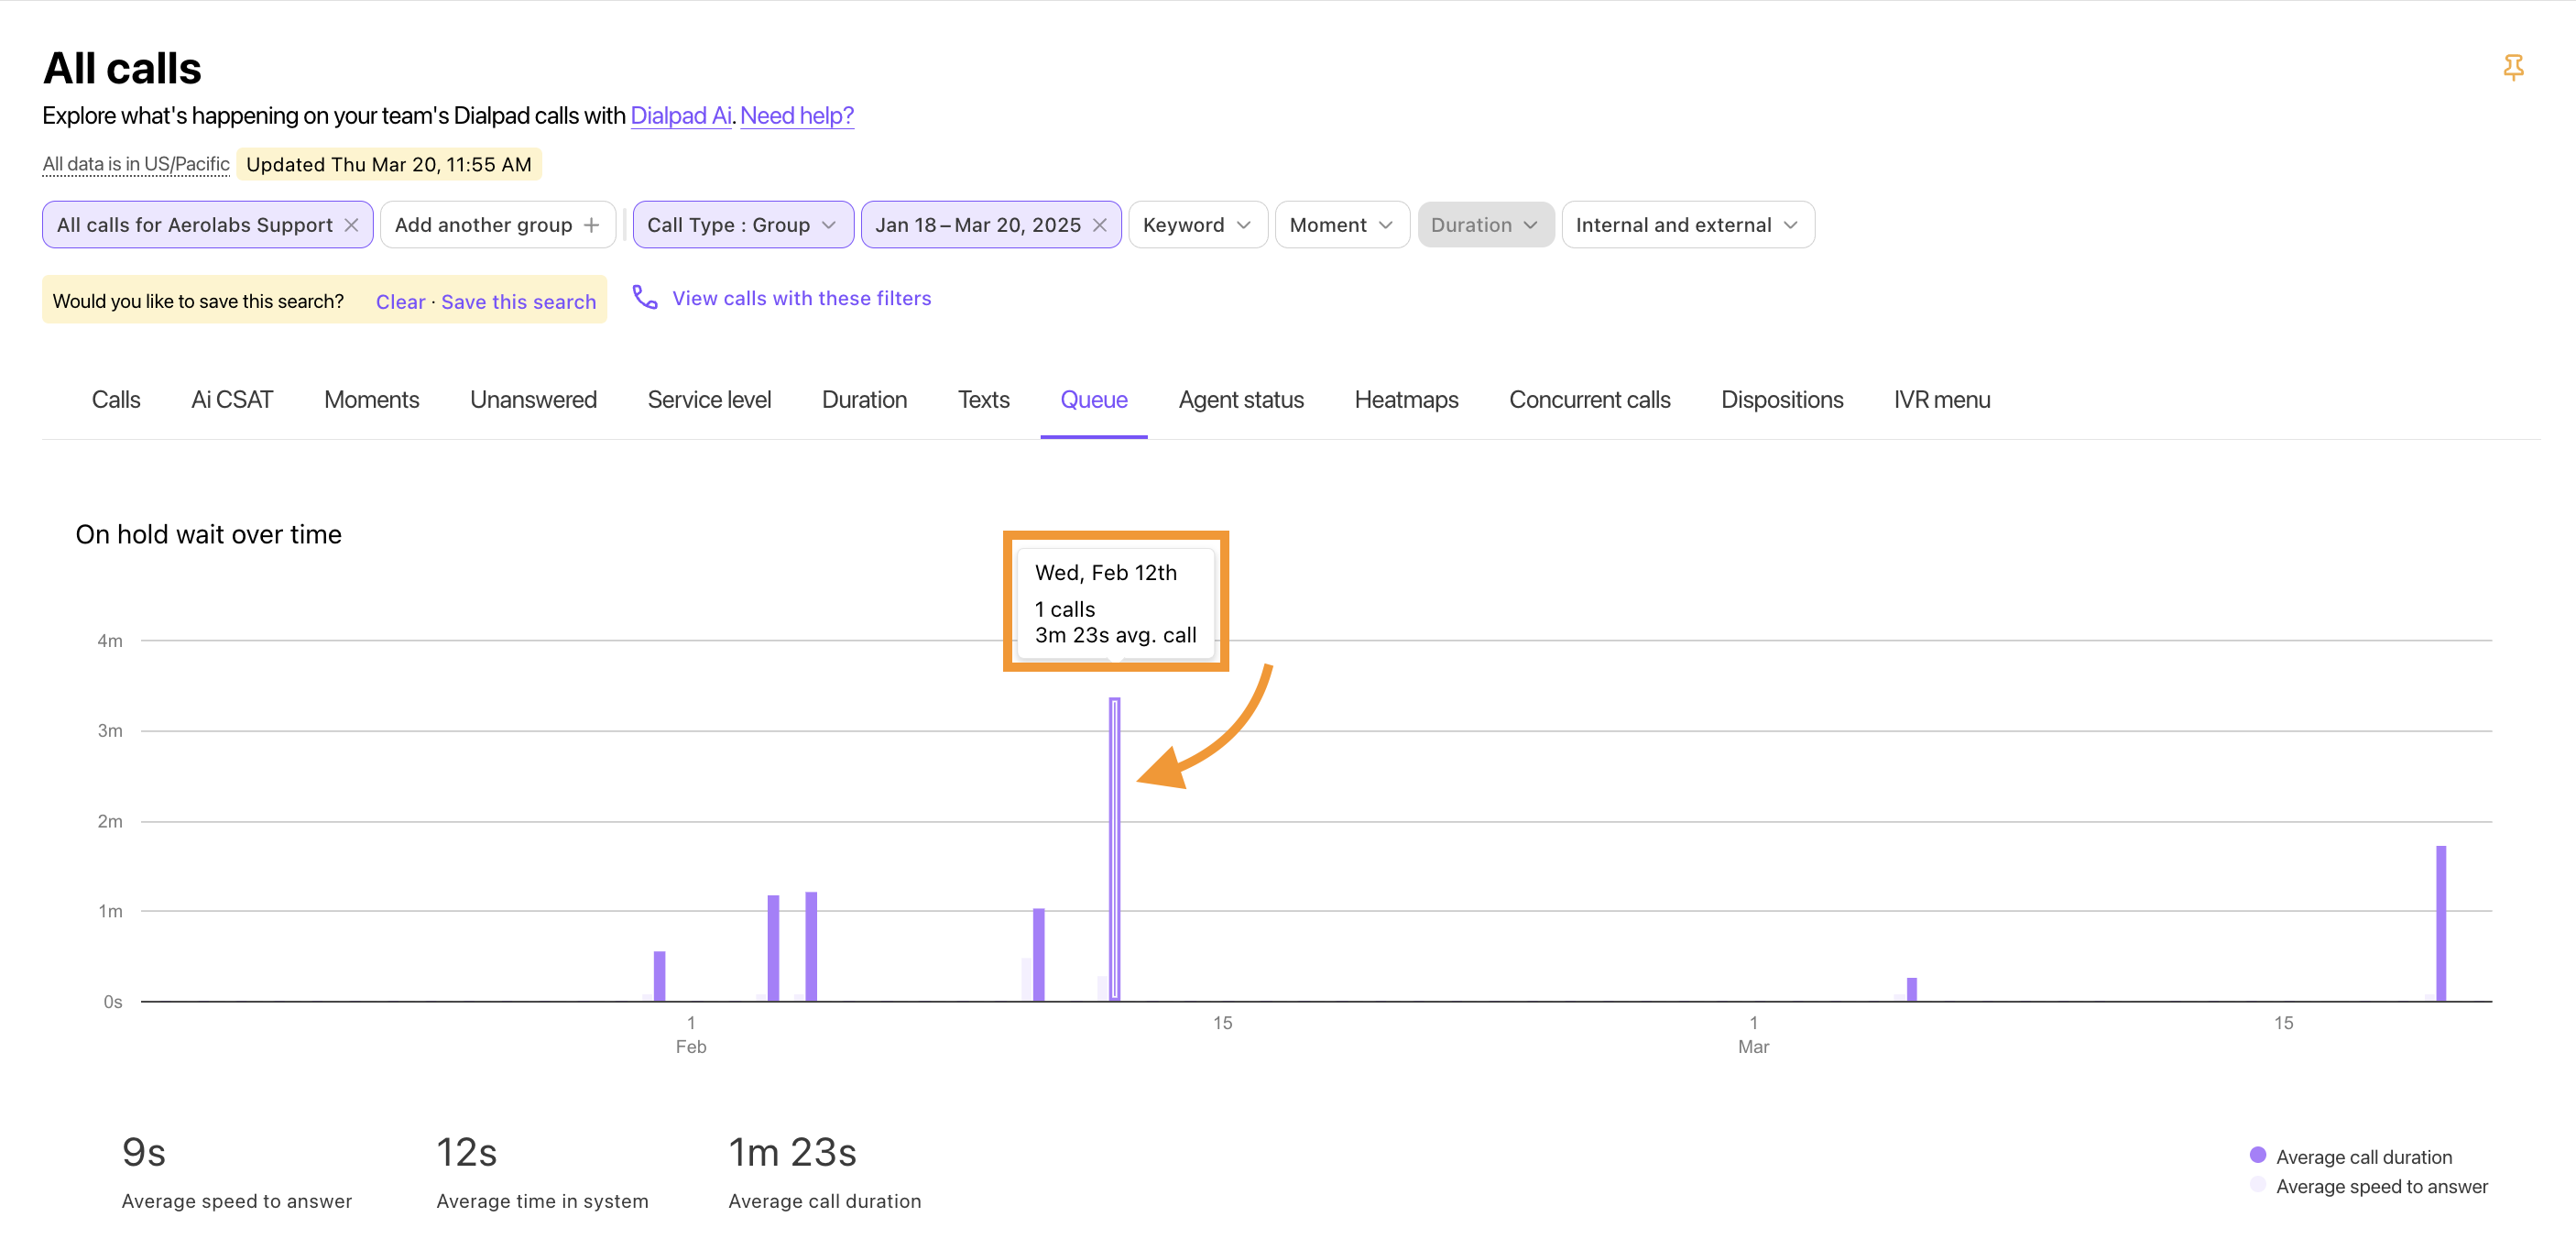
Metrics that are displayed are:
Total Calls | Total calls are all inbound and outbound calls that have been received or placed. This includes connected, missed, abandoned, forwarded, canceled, deleted, and self calls. |
Average speed to answer | The average time it takes an agent to answer an inbound call. |
Average time in system | The average time a caller is in the system before their call is answered. |
Average call duration | The average time of a call with a caller. |
Service level
The Service level chart shows the percentage of the calls where the speed to answer was at or below the service level time threshold set in the Service Level Agreement (SLA).
Hover over each segment to view:
The percentage of calls that reach or exceed the SLA
The percentage of calls that don’t meet the SLA
Agent leaderboard
Agent metrics are shown on the Agent leaderboard, allowing Supervisors and Admins to see agent activity and output.
Agents can be sorted based on the specific metrics, such as total duration of their calls or average time spent on a call, in ascending or descending order. Agent metrics can be filtered to allow supervisors to focus on specific metrics, if needed.
Note
This view is limited to the top 100 agents for any metric you're sorting by. Numbers of calls is set by default.
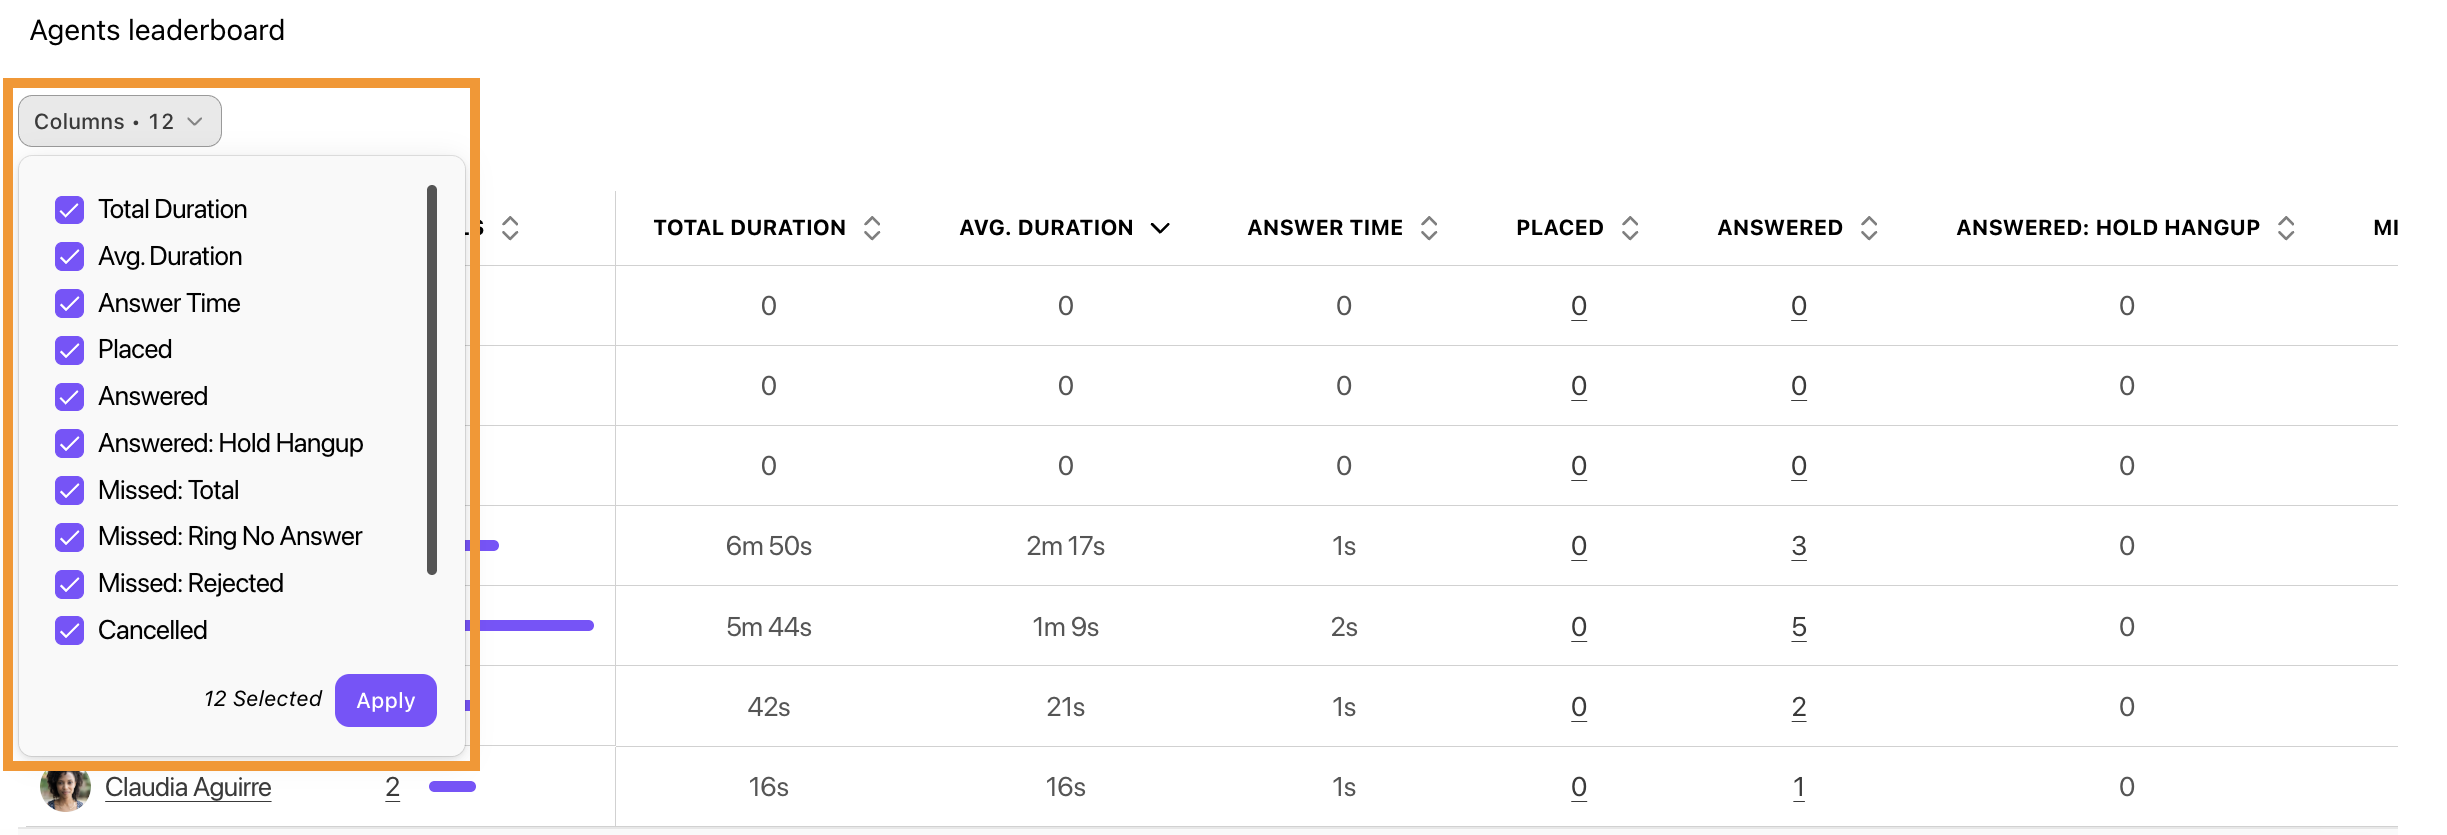
Metrics available to view include:
Calls | The number of total calls for the given agent within the selected group. Total Calls are all inbound and outbound calls that have been received or placed. This includes connected, missed, abandoned, forwarded, canceled, deleted, and self calls. Calls ending in a callback request and callback fulfillment calls are included as well. |
Total Duration | The total connected call duration for all calls for the given user within the selected group. Call duration is the number of minutes spent on a connected call. Only the time from when the call connects to an agent to when the call ends is included in the call duration. It doesn’t include ring time, time spent in a hold queue, or time spent in an IVR menu. |
Avg. Duration | The average call duration for all calls for an agent within the selected group, including all connected and completed inbound and outbound calls. |
Answer Time | The average answer time for all calls experienced by a caller before being connected with an agent. This includes ring time, time spent in queue, or waiting for a callback if a callback was requested.
|
Placed | The total number of outbound connected calls made by an agent within the selected group.
|
Answered | The total number of calls answered by an agent within the selected group. |
Answered: Hold Hangup | The number of calls that are disconnected after answering in the hold segment on an agent extension. |
Missed: Total | The total number of missed calls, including: Missed, Missed: Ring No Answer, and Missed: Rejected. |
Missed: Ring No Answer | The number of calls if the call was rung and missed by an agent. |
Missed: Rejected | The number of calls if the call was rung and rejected by an agent. |
Cancelled | The number of calls where a Dialpad user initiates an outgoing call but hangs up before the call connects to a person, voicemail, IVR menu, or prerecorded message. |
Abandoned: Total | The total number of abandoned calls made to an agent within the selected group. An abandoned call is an inbound call that didn’t end up ringing any agents and wasn’t forwarded through other routing options. Inbound calls are marked as abandoned when:
|
Abandoned: Rang | The number of calls where the caller hangs up or is disconnected in the ringing segment on the agent extension. |
Agent status
The Agent status tab displays the time agents spend in an Available or On-Call status.
Select a bar on the graph to review the daily totals and number of time spent in each status.
Agent status data can be exported to display a summary of agent status periods for the contact center (agent status statistics), or display records of all agent status changes in the contact center (agent status logs).
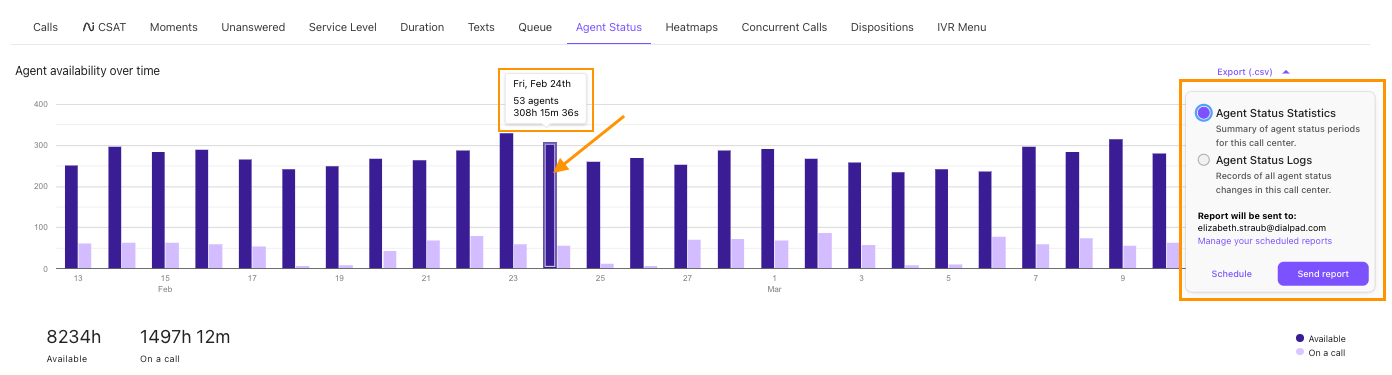
Below the Agent availability over time graph, you'll find an agent leaderboard, providing individual agent information on the amount of time they spent in each state. You can also see the amount of time they spent handling another contact center, which is especially helpful to understand a complete overview of their time.
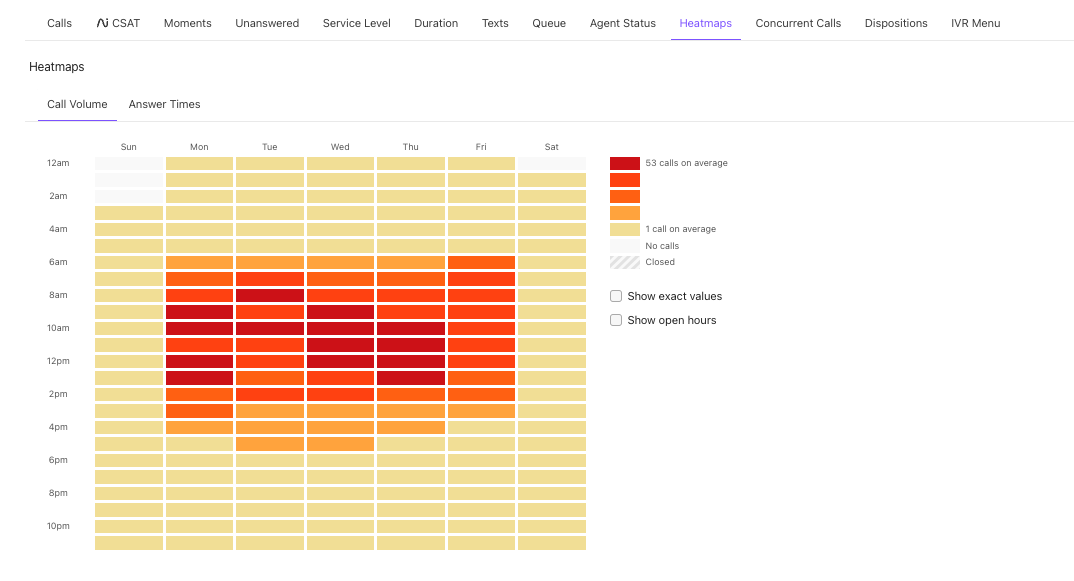
Heatmaps
The Heatmaps tab provides a simplified visualization of your call volume and answer times. Use this tab to figure out when exactly you’ll need more agents available to answer calls, cutting down on lengthy wait times that often hurt customer satisfaction.
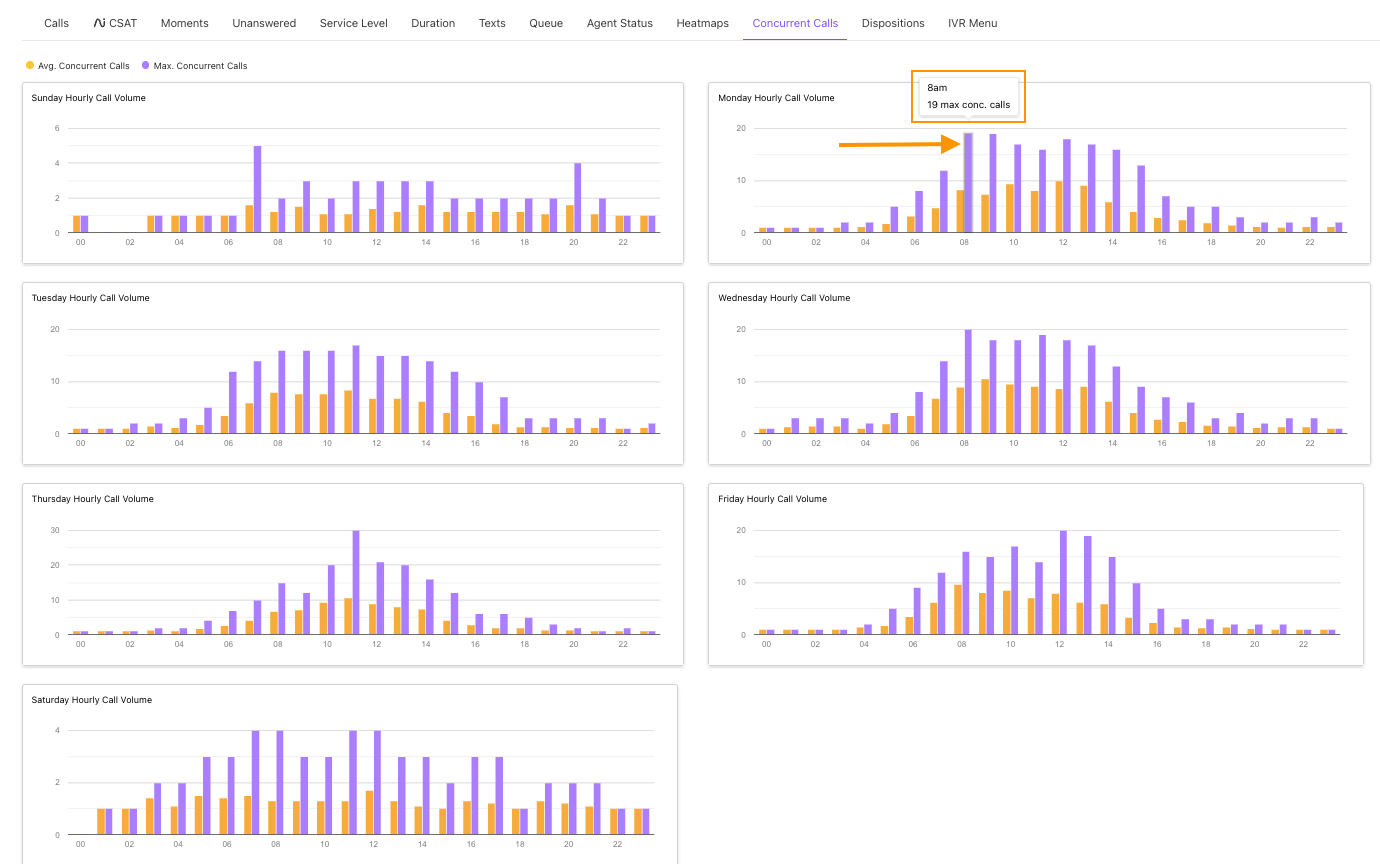
Concurrent calls
The Concurrent Calls tab tracks how many calls are in progress at any one time, each day of the week. It’ll assist in contact center forecasting and aligning agent schedules to prepare for a large number of calls.
Select a bar on the graph to review the totals.
Disposition
The Disposition tab displays an overview of your Call Dispositions usage over time.
If you have not searched for a specific call disposition, this tab will show the top dispositions (by their occurrence count) within the sample of calls you’ve filtered for.
Select a date to see an overview of dispositions used on that day.
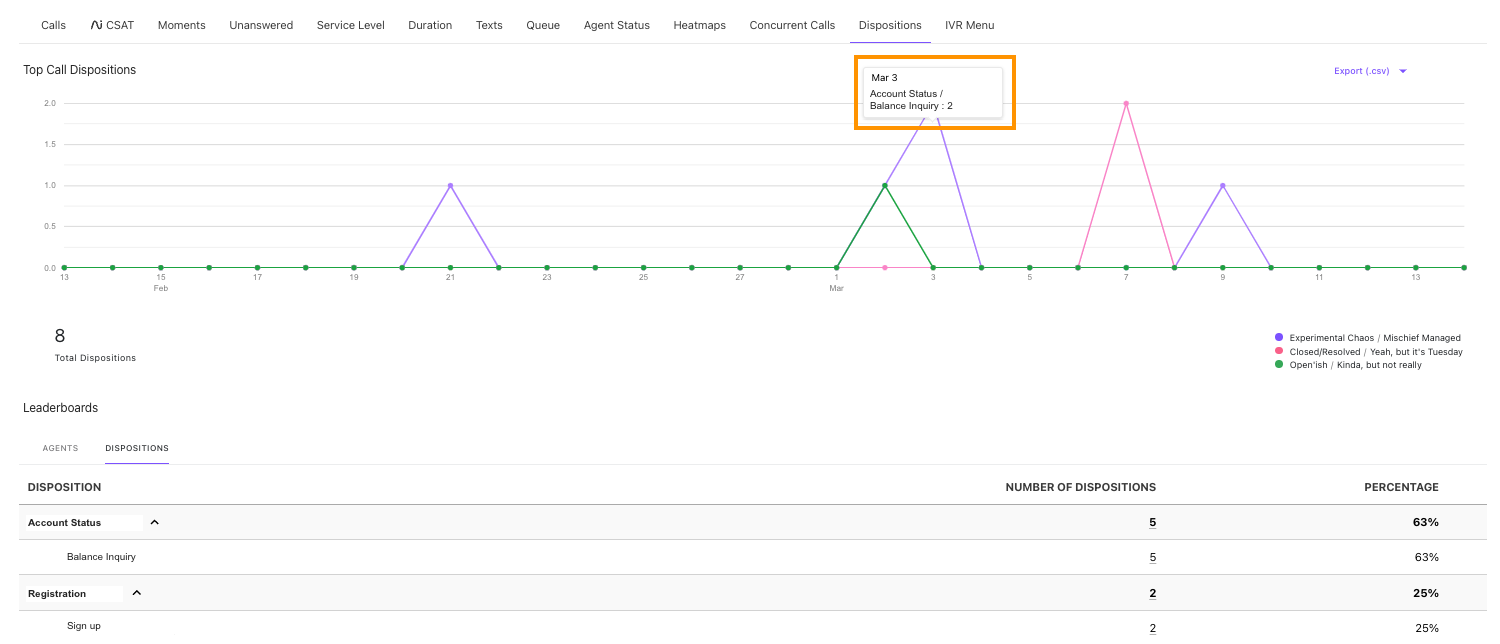
Below the graph, you'll find a breakdown of each disposition's total usage, and percentage used during the selected time period.
IVR menu tab
The IVR Menu tab is a great place for Department and Contact Centers to analyze the use their IVR menus. You'll see IVR menu options, usage count, and usage percentage.
Note
This section covers data from an Automated Response Menu, not Workflows.
Analytics for Workflows is coming soon.
Select a date to see an overview of IVR Menu options used on that day.
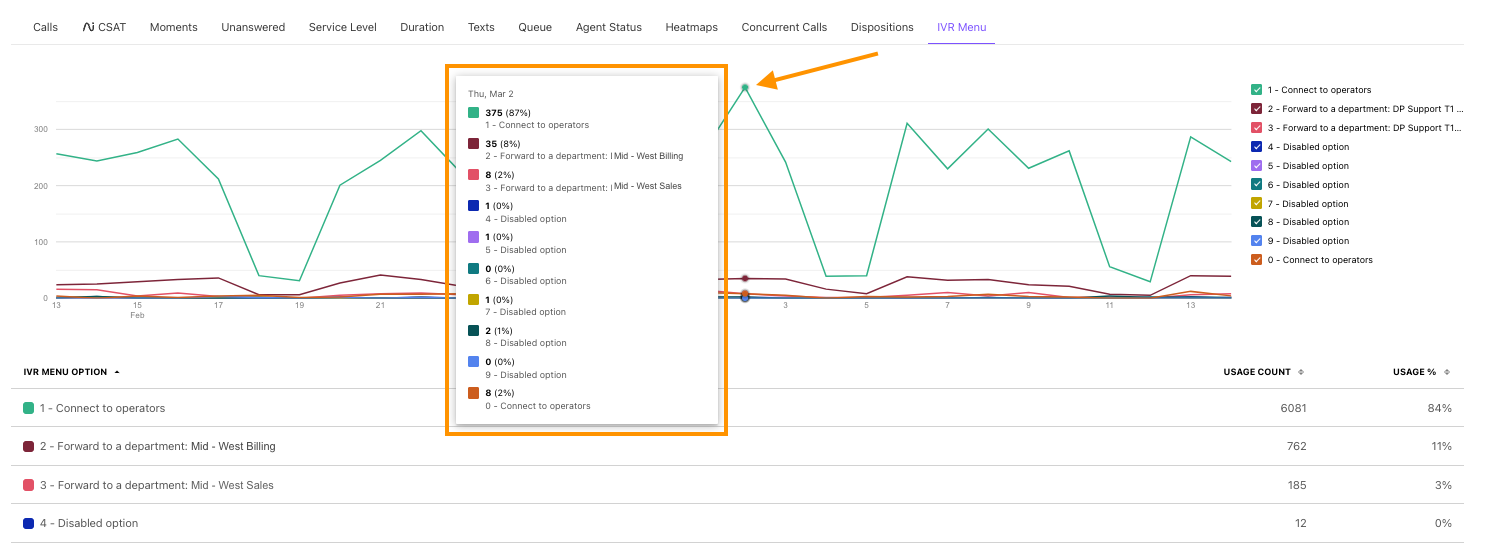
Below the graph, you'll see the usage totals and percentages for each IVR menu option.
Alerts by day
Use the Alerts by Day overview to stay on top of your contact center's performance by tracking how often your Contact Center alerts are triggered. To find the alerts by day overview, scroll below the Call count breakdown on the calls tab.
Here, you'll find a graph overview of the following alerts:
Service Level
Wait Time
Queue Size
No Agents
Agents Off-Duty
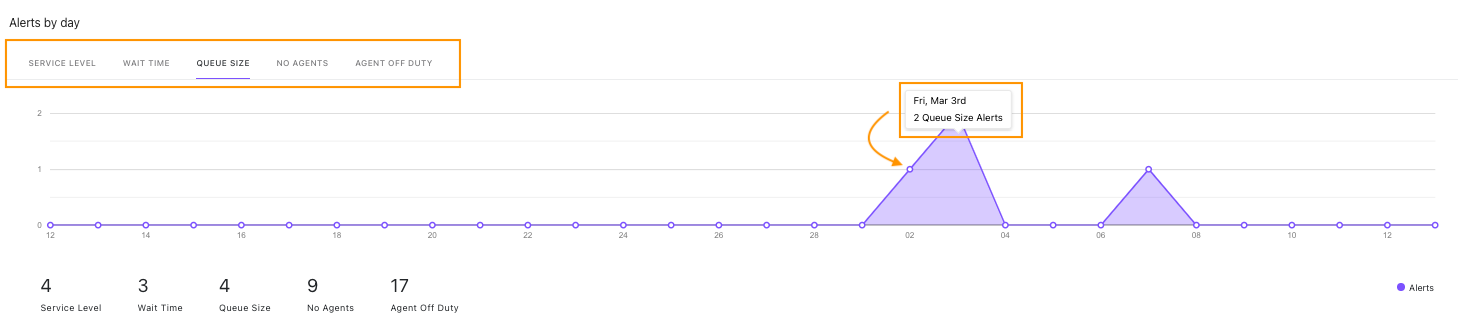
Select a day to view how many times the alert was triggered on that day.
Recommendations by day
Use the recommendations by day overview to see how often your AI Live Coach Cards are being used by your agents. To find the recommendations by day overview, scroll below the call count breakdown on the calls tab.
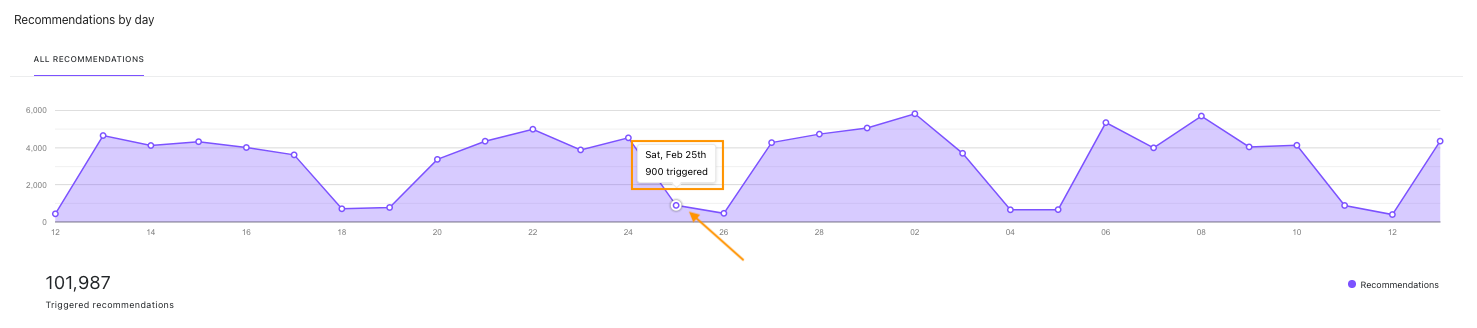 View the grand total of AI Live Coach Cards used at the bottom, and click on a day to view how many times Live Coach Cards were triggered on that day.