Contact Center dashboards unlock real-time performance insights through metrics such as call duration, speed to answer, Agent status, hold times, and much more.
Contact Center Managers and Admins can utilize Dialpad's Multiple Contact Centers Dashboard to simultaneously monitor the health of multiple contact centers, featuring customizable filters and the ability to save searches for repeat use.
Let's dive into the details.
Who can use this
Contact Center Supervisors and Contact Center Admins managing multiple contact centers can easily monitor all their locations in real time from a single, user-friendly dashboard.
Real-time monitoring
To access live Contact Center dashboards, go to your Dialpad Admin Settings.
Select Live Dashboard
Select the dashboard type
Dashboard: Visualizes 10 key call metrics for easy understanding.
Contact Centers: Provides call statistics for each Contact Center in a customizable table.
(1).png)
Each dashboard can be customized to provide you with the granular data you require.
Tip
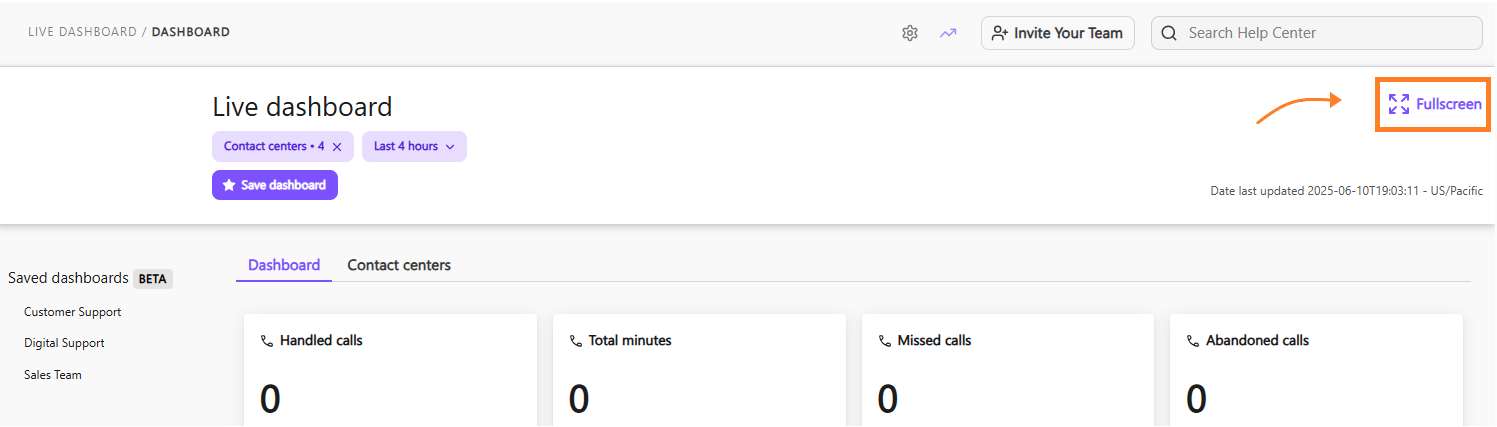
To view your Live Dashboard in fullscreen, select Fullscreen.
Calls dashboard
The Dashboard tab on your Live Dashboard displays these metrics:
Handled calls
Total minutes
Missed calls
Abandoned calls
Call volume
Average call duration
Speed to answer
Service level
Abandon rate
Agent-to-caller ratio
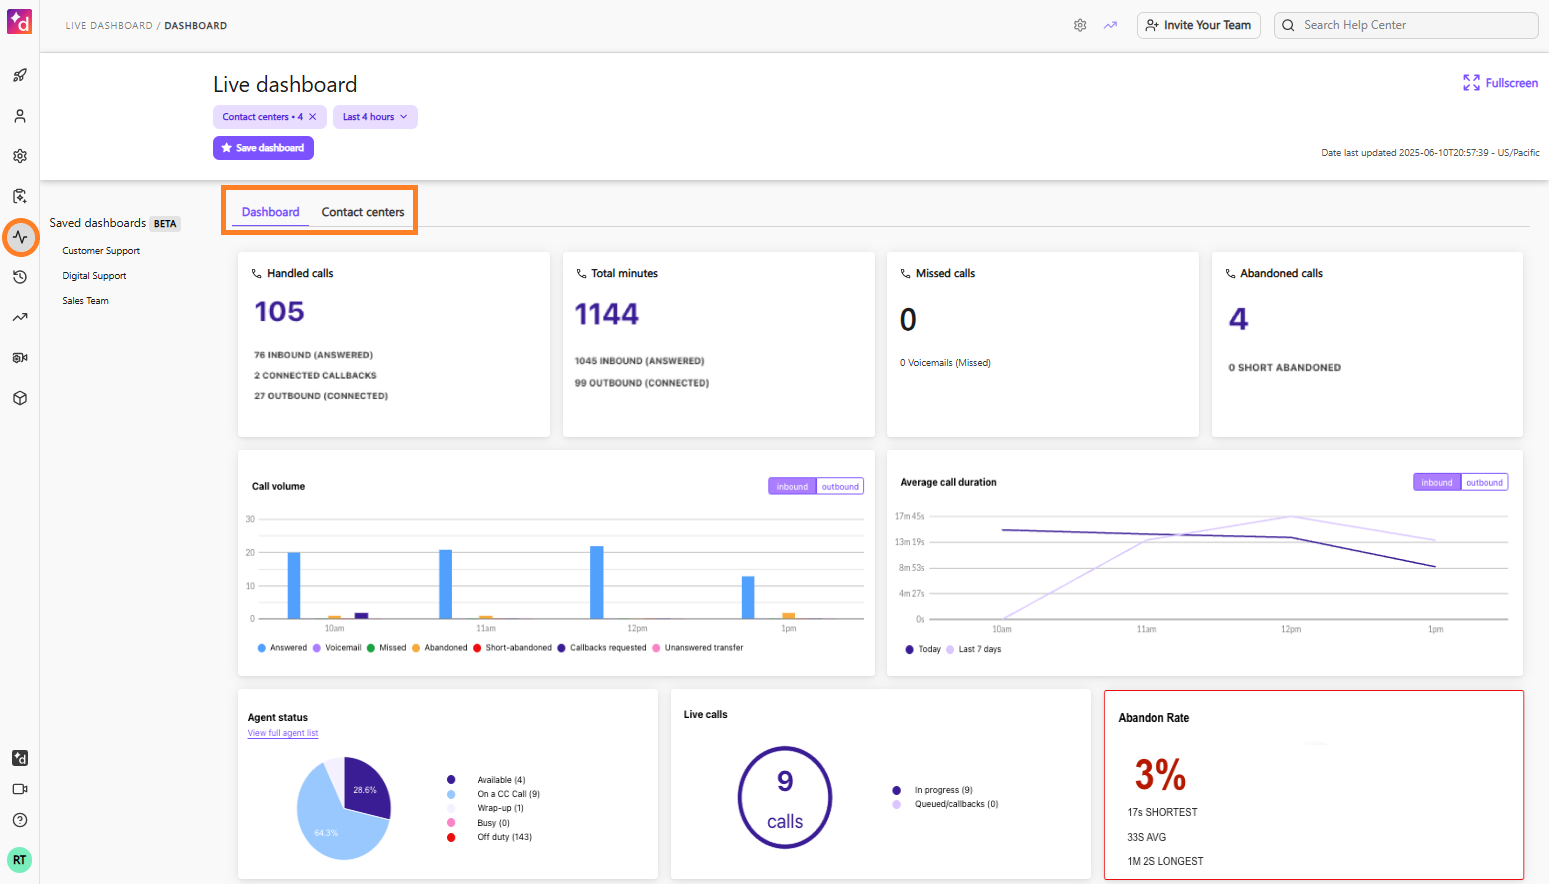
You can also filter by specific Contact Centers and time periods.
Note
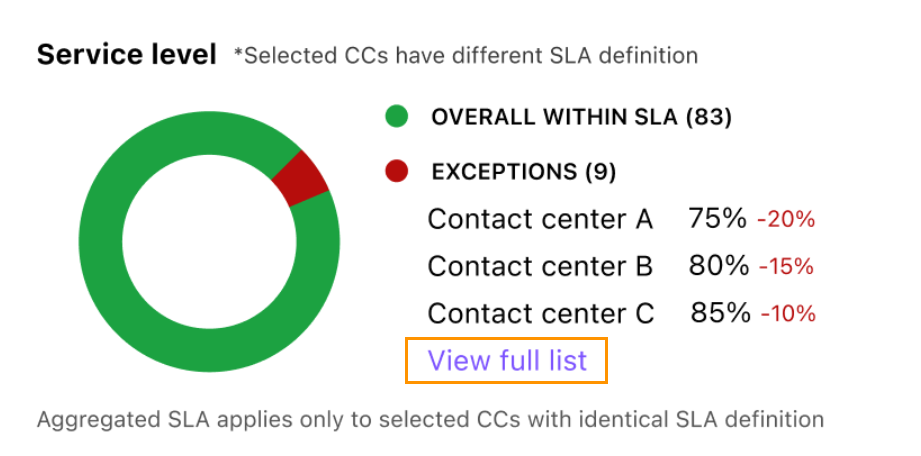
When multiple Contact Centers are selected, the Service Level Widget is not available by default. Contact Customer Care to enable the SLA widget.
If your Contact Centers have different SLAs, you'll see them listed within the widget. Select View full list to see the full SLA details for each Contact Center.
Contact centers dashboard
On the Contact centers tab of the Live Dashboard, you can see real-time metrics for multiple contact centers.
Once you've selected the contact centers, use the Columns filter to determine which data points are displayed.
.png)
The Contact Centers Dashboard can display these details:
Contact Center name
Abbreviated Contact Center Name
Queued calls
Longest wait time
Number of Available Agents
Number of Agents in wrap-up
Number of answered calls
Number of abandoned calls
Number of missed calls
Number of voicemails
Number of connected calls
Number of canceled calls
Average speed to answer (ASA)
Service level
Call Duration
Note
When filtering by Contact Center, you can select up to 50 contact centers. To increase this limit, please contact our Customer Care team.
Save a dashboard
Save your customized dashboard so that you don't have to reset your parameters each time.
To save a dashboard:
Select the desired filters
Select Save new dashboard
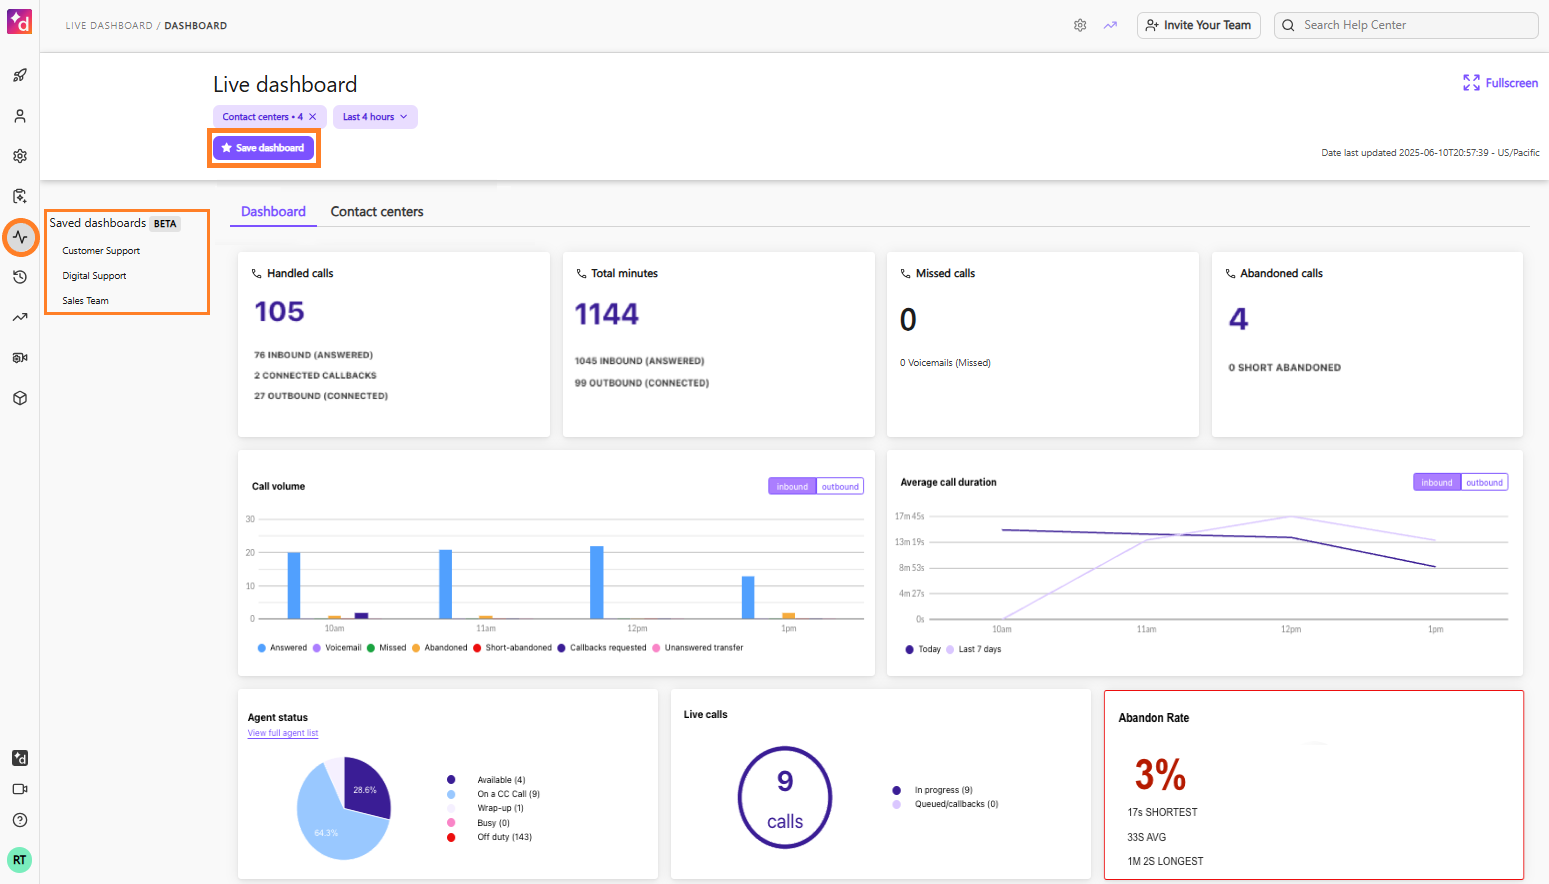
Your saved live dashboard will now appear in the Saved Dashboards section, ready for you to view when you want.
Edit a saved dashboard
Need to make changes to a saved dashboard? No problem.
To edit a saved dashboard, go to your Dialpad Admin Portal.
Select Live Dashboard
Select the desired dashboard from your Saved Dashboards list
Add or remove the filter(s)
Select Save changes
.png)
The Dashboard will automatically update. From this page, you can also save it as a new dashboard or reset all filters.
Delete a saved dashboard
To delete a saved dashboard, head to your Dialpad Admin Portal.
Select the dashboard you'd like to remove
Select the trashcan icon
.png)
Dashboard tab widgets
The Dashboard tab has an individually customizable set of widgets.
Use the widget picker (“Show or hide widgets”) to add, remove, and rearrange them.
The following widgets are currently available:
Unified dashboard for all channels
When filtering by contact centers, you'll see the new distinctions: Voice and Digital, helping you easily identify each contact center type..png)
If a digital contact center is selected, you’ll then be able to filter the dashboard by channel type.
.png)
If a digital contact center is selected, you’ll then be able to filter the dashboard by expertise.
.png)
On the Groups tab, the Wallboard table includes the following columns:
EAP Feature
Some of the metrics in the table below are part of the Early Adopter Program (EAP).
Column | Voice/Digital | Description |
|---|---|---|
Groups | Digital and Voice | Shows the name of the contact center or group. |
ABBR | Digital and Voice | Shows the abbreviated name of the contact center or group. |
Type | Digital and Voice | Shows whether the group is a voice or digital contact center, indicated by a phone or monitor icon. |
Conversations waiting | Digital and Voice | The number of conversations (calls or digital sessions) currently in queue. |
Longest wait time | Digital and Voice | Voice: the wait duration of the longest-waiting call currently in queue. |
Peak wait time | Digital and Voice | The longest wait time recorded during the selected time period. Only reflects conversations that were ultimately answered — it doesn’t include conversations still waiting or that were abandoned. |
Agents available | Digital and Voice | The number of agents available. |
Agents occupied | Digital and Voice | The number of agents currently on a call. Agents handling only digital sessions are not currently included in this count |
Agents busy | Digital and Voice | The number of agents with a “Busy” status (Busy : temporarily unavailable to receive new interactions, which may include handling non-Contact-Center calls or attending a meeting). |
Short Abandoned calls | Voice only | The number of calls that were abandoned by the customer within a short duration after entering the queue (default time is 10 seconds), while the target was open. This excludes SPAM. |
Deflected | Digital only | Sessions that were answered (or handled) by your chatbot and did not connect to an agent. |
Agents in wrap-up | Digital and Voice | The number of agents currently in wrap-up. |
Inbound conversations | Digital and Voice | Voice: the total number of inbound calls received, including calls that were later missed or abandoned. Digital: the total number of digital sessions received, including sessions handled by automation or abandoned in queue. |
Answered conversations | Digital and Voice | Voice: calls that are answered by agents. Digital: sessions that are answered by agents. |
Abandoned conversations | Digital and Voice | Voice: calls that the customer hung up before being connected to an agent (includes both queue and ring abandonment). Digital: sessions that are abandoned in the queue. |
Missed conversations | Digital and Voice | Voice: calls that were not answered by an agent during ring time, including calls the agent rejected or let time out. Digital: sessions that are unanswered. |
Voicemails | Voice only | Calls sent to the inbound voicemail. |
Connected outbound calls | Voice only | Outbound calls that are connected. |
Cancelled outbound calls | Voice only | Outbound calls that didn’t connect to the external party, for any reason (not limited to the agent hanging up). |
Avg. speed to answer | Digital and Voice | Voice: average speed of when calls are answered. Digital: the first response time of a session. |
SLA (%) | Digital and Voice | Voice: calls that are within the SLA percentage. Digital: sessions that are within the SLA percentage. Both the threshold and target percentage are configurable per contact center. |
Agent Avg. conversation time (ACD) | Digital and Voice | Voice: the average duration of a call. Digital: the average duration of a session. |
Average talk time | Voice only | The average talk time on a call. |
Short abandoned (%) | Voice only | The percentage of callers who disconnected within the first few seconds, based on the configured threshold. |
Agent Longest conversation time | Digital and Voice | The duration of the longest conversation completed within the selected time period. |
Callbacks requested | Voice only | The total number of callback requests made by customers during the selected time period. |
Callbacks attempted | Voice only | The number of callback attempts made, helping to track agent activity and callback effort. |
Average handle time | Digital and Voice | The total time an agent spends handling a conversation, including active conversation time and any associated after-conversation work. |
Completed peak hold time | Voice only | The longest individual customer hold time recorded during the selected time period. |
Completed calls on hold | Voice only | The number of calls that were put on hold during the selected period. |
Active outbound conversations | Digital and Voice | The real-time number of live outbound calls and digital sessions currently in progress. |
Active answered conversations | Digital and Voice | The real-time number of live inbound calls and agent-answered digital sessions currently in progress. |
Transferred conversations | Digital and Voice | Calls and digital sessions transferred to another agent, extension, or contact center. |
Active calls on hold | Voice only | The real-time number of calls currently on hold. |
Outbound completed conversations | Digital and Voice | The number of outbound calls and digital sessions that have completed. |
Automation ACD | Digital only | The average automation conversation duration. |
Productivity (%) | Digital and Voice | The percentage of an agent’s time spent occupied or in wrap-up out of the total time they were joined to this contact center (excluding time logged out). |
Notes
Your filter selection is automatically saved. If you set a filter, switch to another report, and return, your last selected criteria will still be applied on the dashboard.
Dashboard saving isn’t available yet in the Unified Real-Time Dashboard Early Adopter Program, but don’t worry—it’s coming soon!
Customize your dashboard
Notes
Your filter selection is automatically saved. If you set a filter, switch to another report, and return, your last selected criteria will still be applied on the dashboard.
Dashboard saving isn’t available yet in the Unified Real-Time Dashboard Early Adopter Program, but don’t worry—it’s coming soon!
Customize your dashboard
Want more control over your dashboard? Customize your layout and place widgets exactly where you need them.
To customize your dashboard:
Select Customize
.png)
Drag and drop widgets into the desired location
Select the eye icon to hide or display a widget
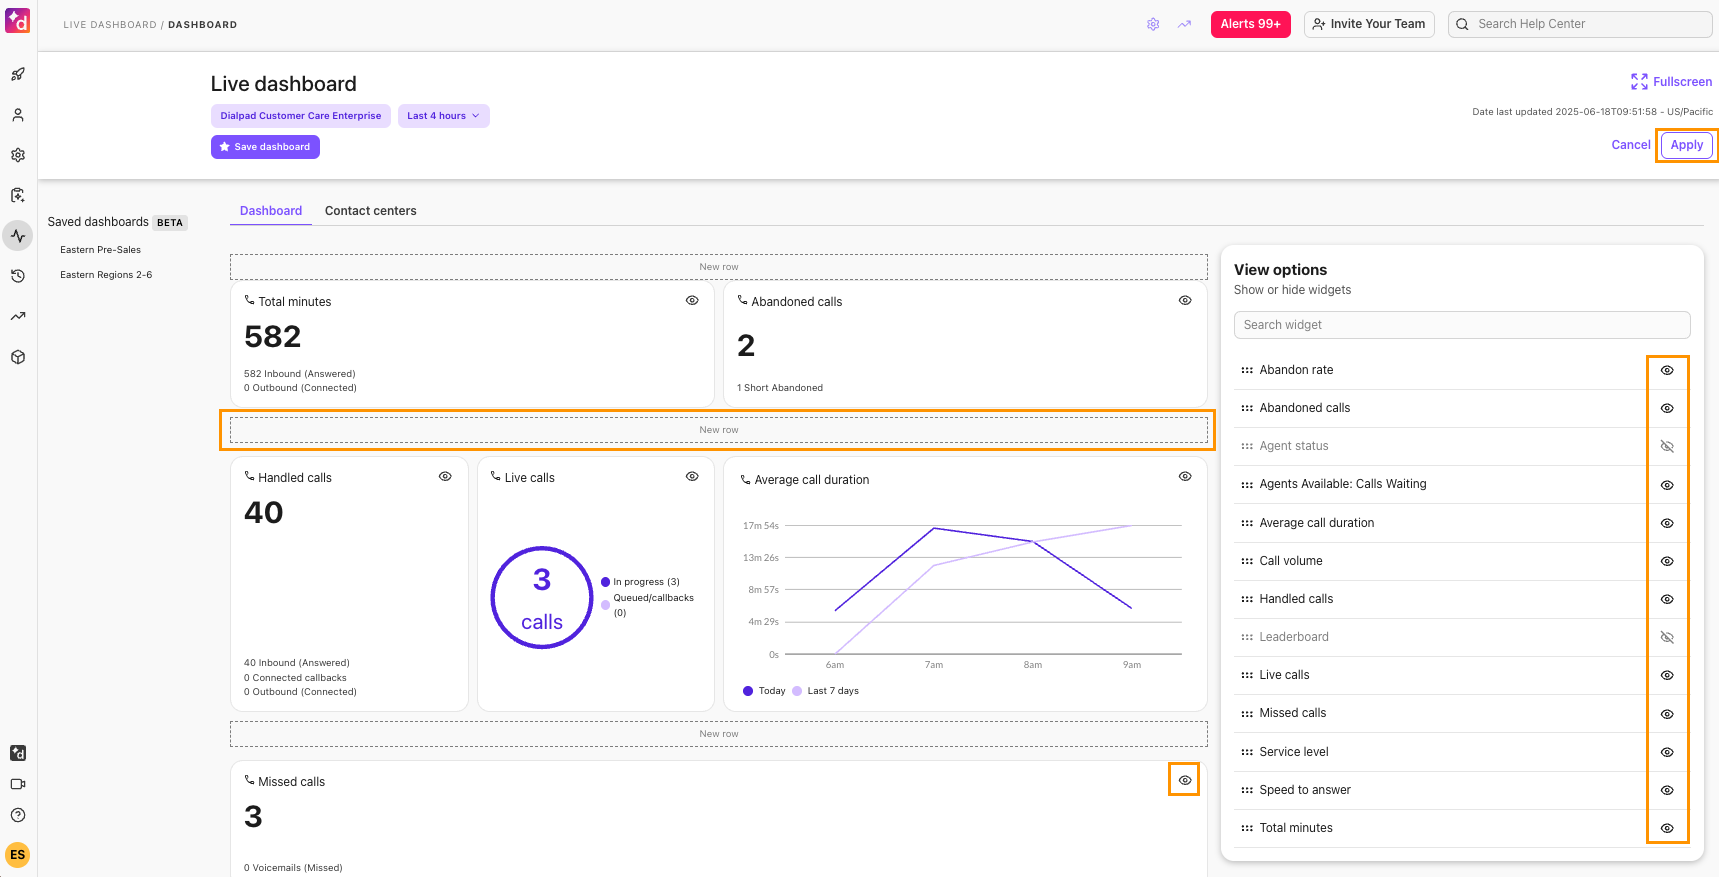
Select Apply
Agent leaderboard
Add the Leaderboard widget from the Dashboard tab to see a live, per-agent table.
To customize the leaderboard, select Edit, then use the eye icon to hide or show specific metrics. To sort the leaderboard by a particular metric, select the down arrow in that column header.
If you only want to view how agents are performing and filter out admins and supervisors, toggle on the Agents only option at the top of the leaderboard.
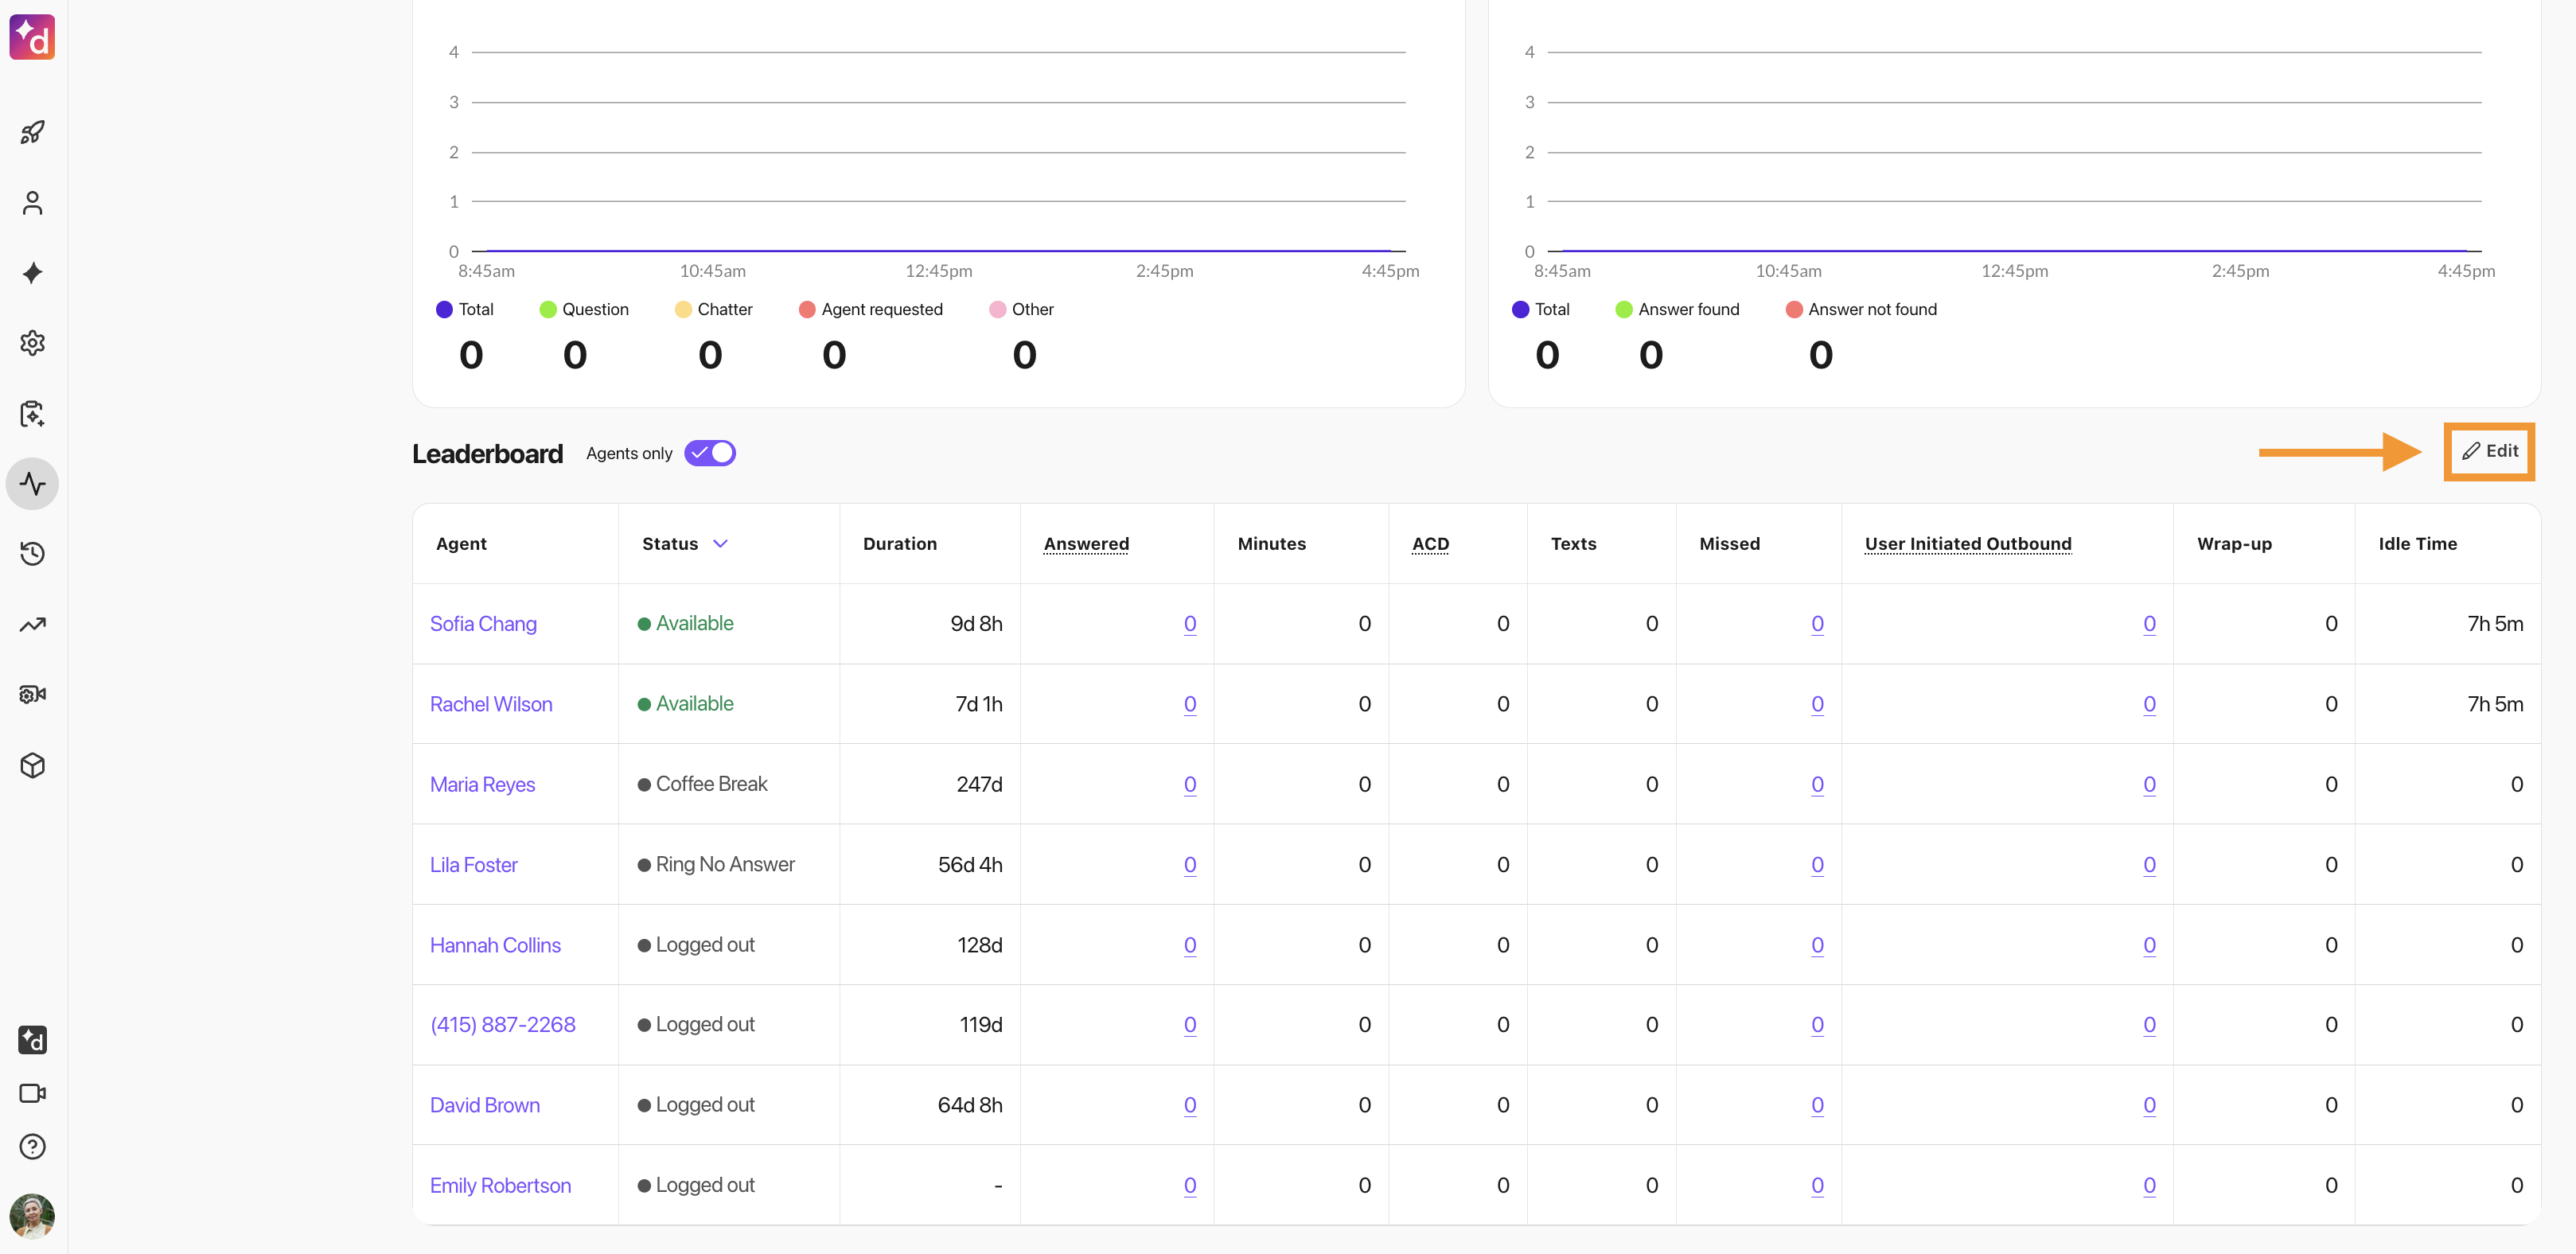
Agent Leaderboard includes the following columns:
EAP Feature
Some of the metrics in the table below are part of the Early Adopter Program (EAP). Please reach out to your Customer Success Manager to learn more details.
Column | Voice/Digital | Description |
User | Digital and Voice | The agent’s name. |
Groups | Digital and Voice | The contact centers or coaching teams the agent belongs to.
|
Groups Available | Digital and Voice | The groups the agent is currently active and available to take conversations in, in real time. |
Global status | Digital and Voice | The agent’s overall presence status across all their contact centers (for example, Available or Occupied). |
Global sub-status | Digital and Voice | More detailed status information within the agent’s global status, such as a custom break, Training, or After-Call Work. |
Sub-status duration | Digital and Voice | How long the agent has been in their current sub-status. |
Personal status | Digital and Voice | The agent’s personal presence status set by the user (for example, “In a meeting”), separate from their contact center status. |
Status duration | Digital and Voice | How long the agent has been in their current global status. |
Productivity | Digital and Voice | The percentage of an agent’s time spent occupied or in wrap-up out of the total time they were joined to this contact center (excluding time logged out). |
Answered | Digital and Voice | The total number of calls and digital sessions answered by the agent.
|
Minutes | Digital and Voice | The total duration of the agent’s connected calls and digital sessions. |
Avg. connected duration | Avg. connected duration | The agent’s average duration per connected call — falls back to the digital session average only when the agent has no voice calls in the period (not a blended average across both channels). |
Texts | Digital only | The number of texts handled by the agent. |
Missed | Digital and Voice | The total number of calls and digital sessions missed by the agent. |
Outbound conversations | Digital and Voice | The total number of outbound calls and digital sessions initiated by the agent. |
Avg. Talk Time | Voice only | The agent’s average percentage of talk time on calls, as measured by call analytics. |
Wrap up | Digital and Voice | The total duration the agent has spent in wrap-up. |
Idle Time | Digital and Voice | The total time the agent has spent in an Available status. |
Transferred conversations | Digital and Voice | The total number of calls and digital sessions transferred to or from another contact center or extension. |
Callbacks attempted | Voice only | The total number of callback attempts made by the agent. |
Participant | Digital and Voice | The contact name for the agent’s active conversation. |
You can filter leaderboard columns for specific data, such as by agent, duration, status, and sub-status.

Note
Column filtering isn’t available for Groups or Groups Available. Hover over the contact center names in those columns for that agent to see the names of the contact centers they’re associated with.