The Real-Time Dashboard for Coaching Teams gives sales managers a real-time view of how their Coaching Teams are performing, using live metrics such as outbound connection rate, call volume, and agent states to support agile decision-making and goal tracking. If you manage Contact Centers, learn more in Real-Time Dashboard for Contact Centers — these dashboards are closely related and designed to work together.
Let's dive into the details.
The Real-Time Dashboard for Coaching Teams is available to Coaches, Contact Center Supervisors, and Contact Center Admins with Analytics permissions.
Real-time monitoring
Use the Real-Time Dashboard for Coaching Teams to:
Monitor seller engagement and performance: Use analytics to ensure sellers (agents) remain engaged in their tasks and to provide a quick overview of seller activity.
Identify issues: Recognize productivity patterns, address anomalies, and proactively spot signs of underperformance or inefficiency.
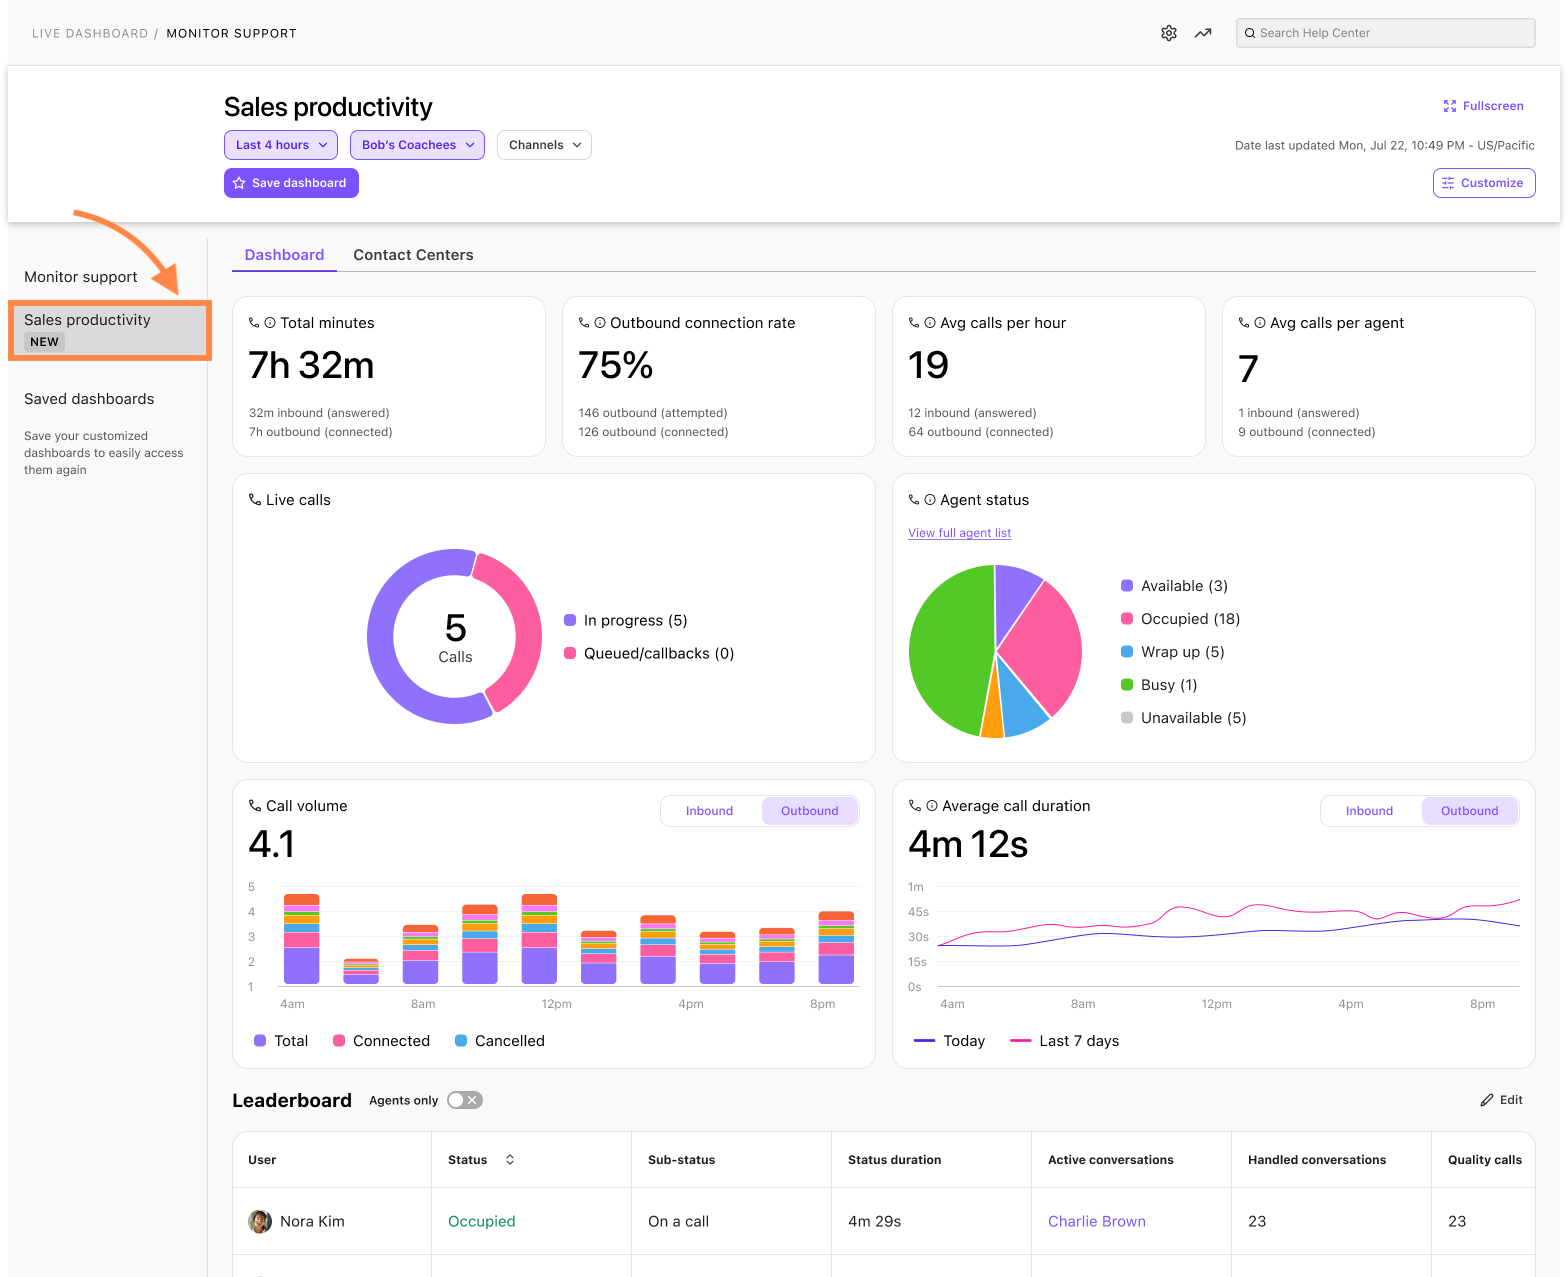
The Live Dashboard is a single dashboard that concentrates all relevant sales metrics for your Coaching Teams, and you can configure which widgets and metrics you want to see.
To access the Sales Live Dashboard for Coaching Teams, go to your Dialpad Admin Settings.
Select Live Dashboard
In the dashboard selector, select Sales productivity to load the Coaching Teams view
If your organization has only a Sell license, you’ll go directly to the Sales preset.
Select the dashboard type:
Dashboard: Visualizes key call metrics for easy understanding.
Groups: Provides call statistics for each Contact Center and/or Coaching Team in a customizable table.
Use the filters at the top of the page to focus on specific Coaching Teams, Contact Centers, call types, and time ranges (see Dashboard Filters below)
Each dashboard can be customized to provide you with the granular data you need.
To view your Live Dashboard in full screen, select Fullscreen.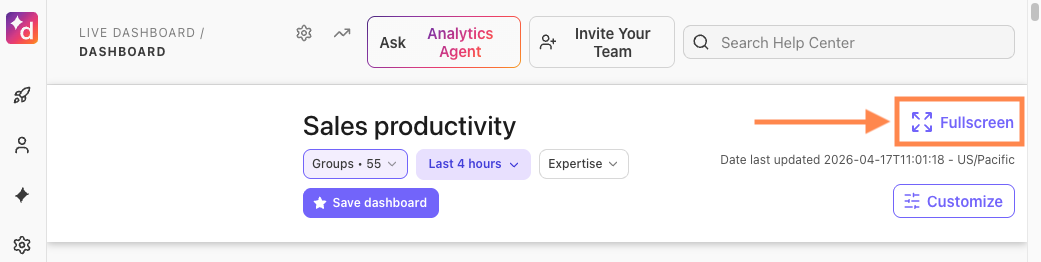
Dashboard filters
The Real-Time Dashboard for Coaching Teams supports the following filters:
Target group | Filter by specific Coaching Teams. |
Call type | Filter by Inbound or Outbound calls. |
Date range | Filter the dashboard by a specific date range to focus on a particular day, week, or custom period. |
These filters work together, so you can combine, for example, a Coaching Team plus one or more Contact Centers, and then narrow down to outbound calls over a specific date range.
Dashboard Metrics
The Dashboard tab on your Live Dashboard displays these metrics:
Metric | Definition | Formula / Submetrics |
|---|
Abandon rate | The percentage of all inbound calls that were abandoned. Short-abandoned calls are included in the total abandoned call count. | |
Abandoned calls | Inbound calls that didn’t end up ringing any Agents. | |
Active agent sessions | The number of active agent sessions in a 15-minute interval | |
Active queued | Total number of currently active customers in the queue | |
Agent sessions by channel | The number of sessions that required agent involvement in the interval | |
Agents Available: Calls Waiting | The number of agents currently available to take calls or handle calls in the given contact center. Calls Waiting is the total number of in-progress and queued calls, including callback requests. | |
AI Agent answers | A breakdown of all AI Agent answers. | Submetrics include Total, Answer Found, and Answer Not Found. |
AI Agent answers feedback | Displays an overview of the AI Agent’s answer feedback (the number of thumbs up and thumbs down feedback was given to the AI Agent). | |
AI Agent queries | A breakdown of all AI Agent queries by detected intent. | Submetrics include Total, Question, Chatter, Agent requested, and Other. |
Automation sessions by channel | The number of sessions in automation in a 15-minute interval. | |
Available session capacity | The maximum number of available sessions in a 15-minute interval. | |
Outbound Connected Rate | The percentage of calls that connect to a live prospect, used to monitor dial efficiency and lead quality. | Formula: (outbound calls answered / outbound calls made) x 100. Submetrics include Total outbound calls and Total outbound connected calls. |
Average Calls per Hour | A KPI widget that shows the average calls per hour to spot drop-offs in productivity. | Formula: Total calls by all agents (Inbound and outbound) / Total Logged-in hours of all agents. |
Call volume | Volume of inbound and outbound calls. | |
Calls on hold | Live and completed calls on hold with their peak hold times and longest live hold time. | |
Avg Calls per Agent | A KPI widget to measure agent productivity. | Numerator: Number of connected inbound + connected outbound calls. Denominator: Agents who handled at least one call. |
Deflection rate | The percentage of total sessions that were solved by your chatbot and did not connect to an agent. | |
Digital & Email SLA | Displays how many interactions were within (or breached) your digital and email SLA. | |
Handled calls | The total number of calls (placed and received) by a trainee or coaching team within a selected time period. | |
Live calls | Total calls in progress and queued calls, plus callback requests waiting for a callback. | |
Missed calls | Calls that rang out without being answered. | |
Service level | The percentage of inbound calls that were answered within a set time threshold. | |
Sessions | The number of Total sessions, automated sessions, abandoned-in-queue sessions, and agent-answered sessions. | |
Speed to answer | The average speed at which calls are answered, or the first response time for digital sessions. | |
Survey CSAT | Displays the CSAT survey completion percentage and the average survey score. | |
Survey engagement | Displays the number of surveys that were offered, not completed, completed, and the percentage rate. | |
Total Minutes | A KPI widget to track the total minutes of calls made by the sales team, which includes Inbound answered and outbound connected calls. | Displays submetrics for total minutes by inbound and outbound, and total minutes trends (compared to the previous period of time). |
Avg Call Duration | A line chart showing average call duration to track customer engagement. Can be filtered by Inbound/outbound. | Not applicable (line chart). |
Agent States Overview | A real-time summary panel/pie chart for instant visibility into team availability and live engagement. | Agent states are grouped by available, busy, on call, wrap-up, and off duty, displaying both the percentage and number of agents per state. |
Agents Leaderboard for Coaching Teams | A list to compare agents within a coaching team. | Columns include: Agent name, Agent status, Total calls (inbound + outbound), Total outbound calls, Total Quality calls, Avg calls per hour, Avg calls, Avg call duration, Total Messages, Avg Playbook adherence, Dispositions (Call count), and Avg scorecard grade. |
You can also filter by specific groups and time periods.
Groups Dashboard
On the Groups tab of the Live Dashboard, you can see real-time metrics for multiple Contact Centers and Coaching Teams.
Once you've selected the Contact Centers and/or Coaching Teams, use the columns filter to determine which data points are displayed.
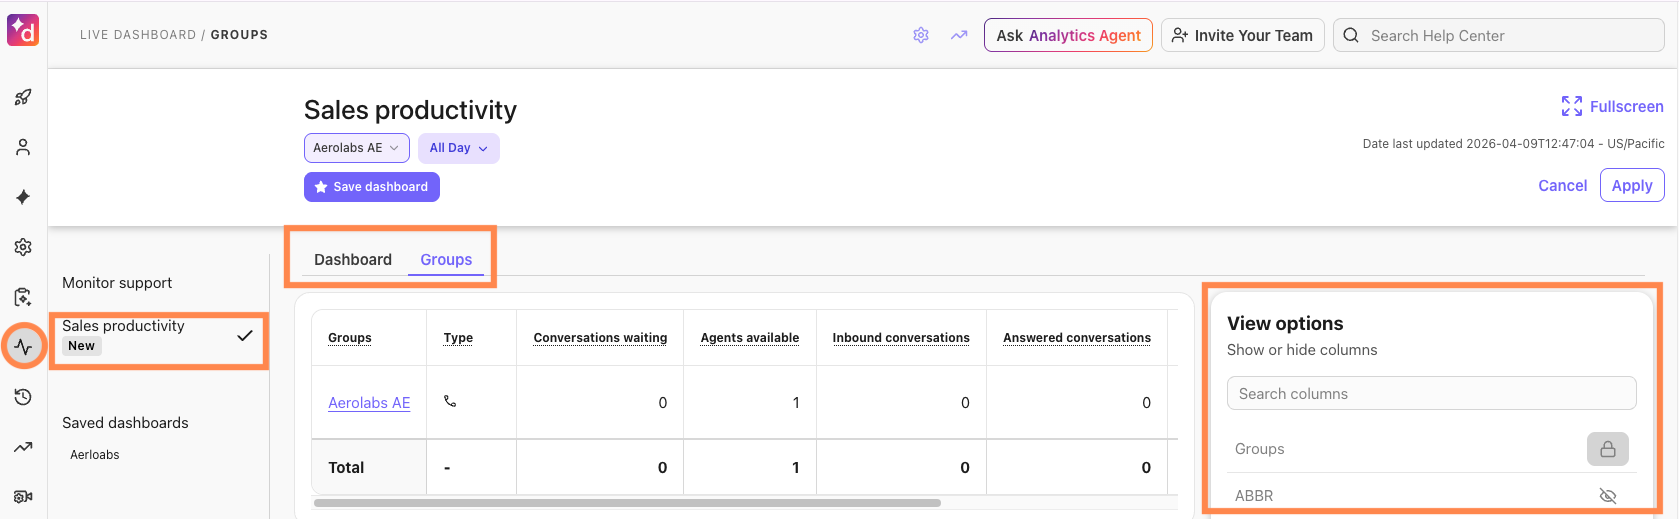
The Groups Dashboard can display these details:
Group name
Abbreviated Group Name
Type
Conversations waiting
Longest wait time
Peak wait time
Agents available
Agents occupied
Agents busy
Short abandoned calls
Agent Longest conversation time
Callbacks requested
Callbacks attempted
Completed peak hold time
Completed calls on hold
Average handle time
Deflected
Number of Agents in wrap-up
Active outbound conversations
Inbound conversations
Answered conversations
Abandoned conversations
Missed conversations
Voicemails
Connected outbound calls
Cancelled outbound calls
Avg speed to answer
SLA (%)
Agent Avg conversation time (ACD)
Average talk time
Avg calls per hour
Outbound connected rate (%)
Calls with dispositions
Quality calls
Avg playbook adherence rate (%)
Avg scorecard rate
You can select up to 400 groups.
Save a dashboard
Save your customized dashboard so that you don't have to reset your parameters each time.
To save a dashboard:
Select the desired filters
Select Save dashboard
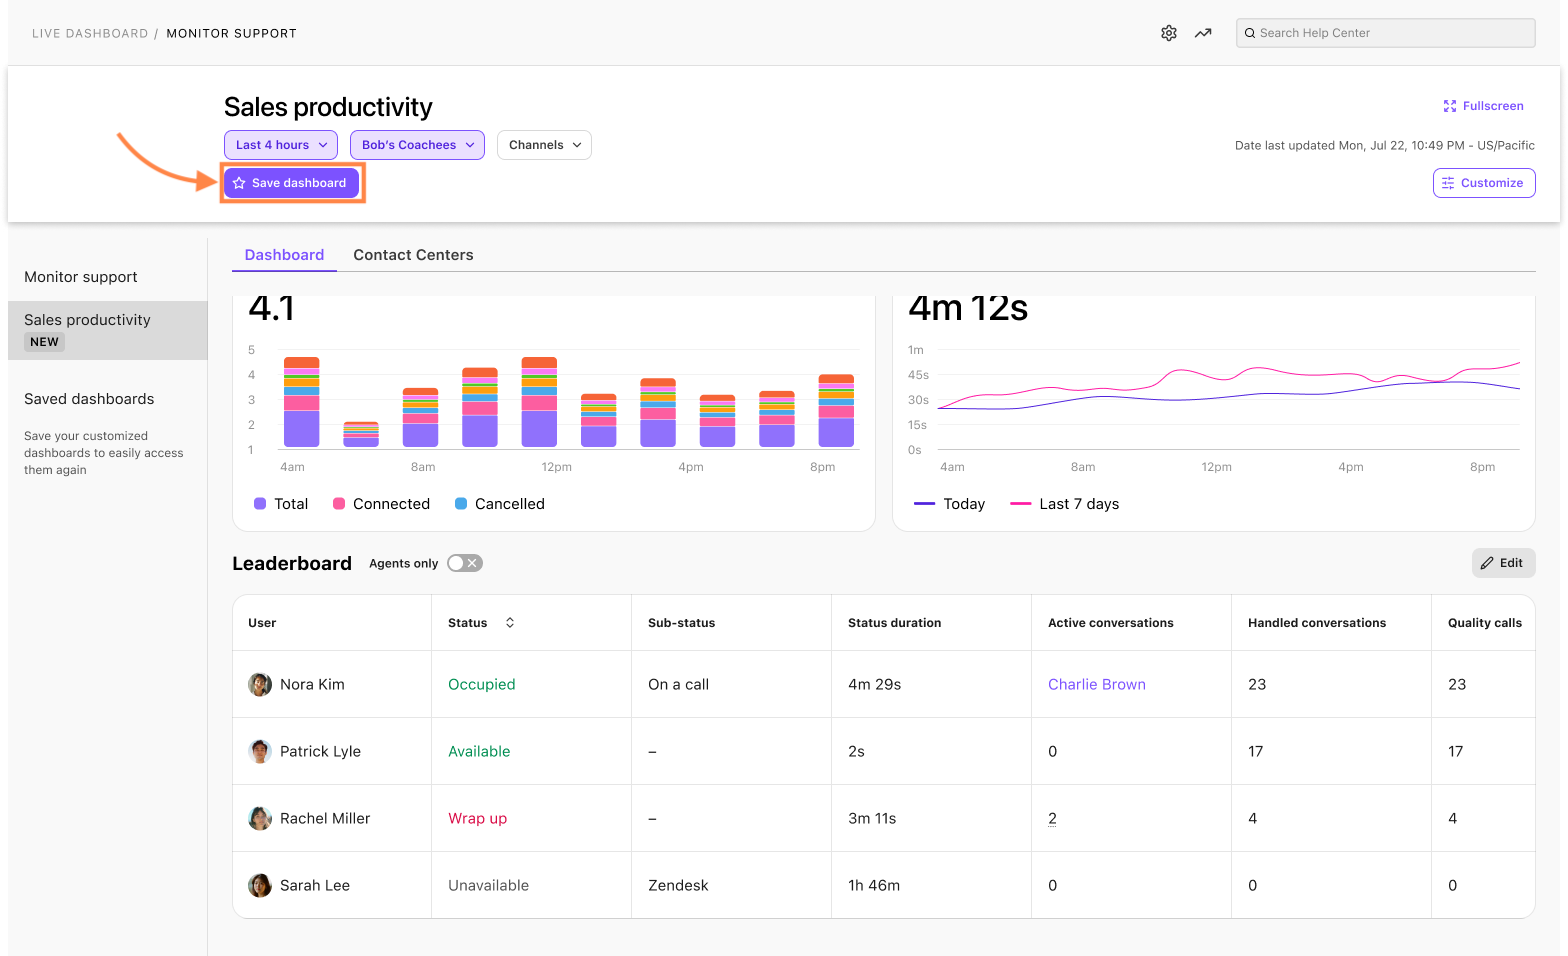
Your saved live dashboard will now appear in the Saved Dashboards section, ready for you to view when you want.
Edit a saved dashboard
To edit a saved dashboard, go to your Dialpad Admin Settings.
Select Live Dashboard
Select the desired dashboard from your Saved Dashboards list
Add or remove the filter(s)
Select Save changes
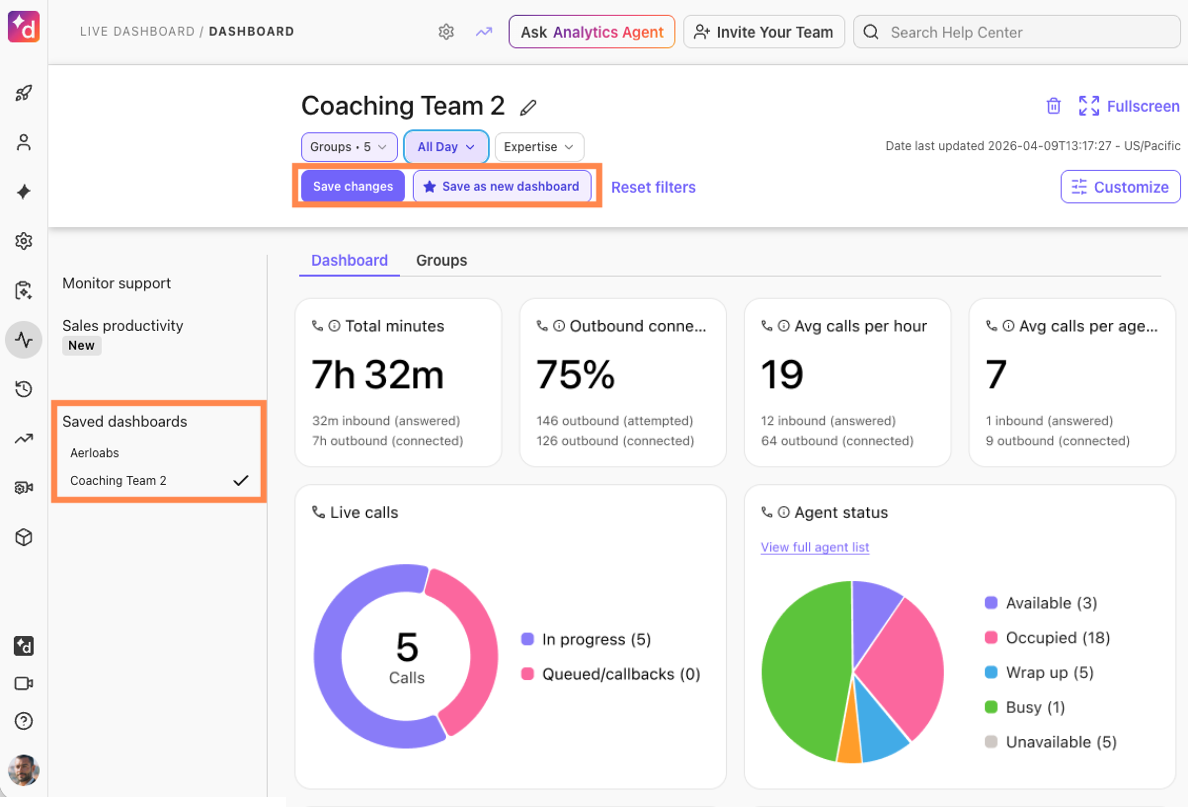
The Dashboard will automatically update. From this page, you can also save it as a new dashboard or reset all filters.
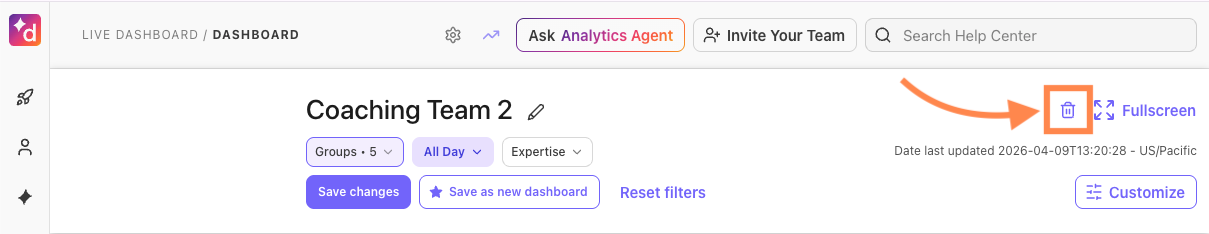
Delete a saved dashboard
To delete a saved dashboard, go to your Dialpad Admin Settings.
Select the dashboard you'd like to remove
Select the trashcan icon
Customize your dashboard
Customize your layout and place widgets exactly where you need them.
To customize your dashboard:
Select Customize
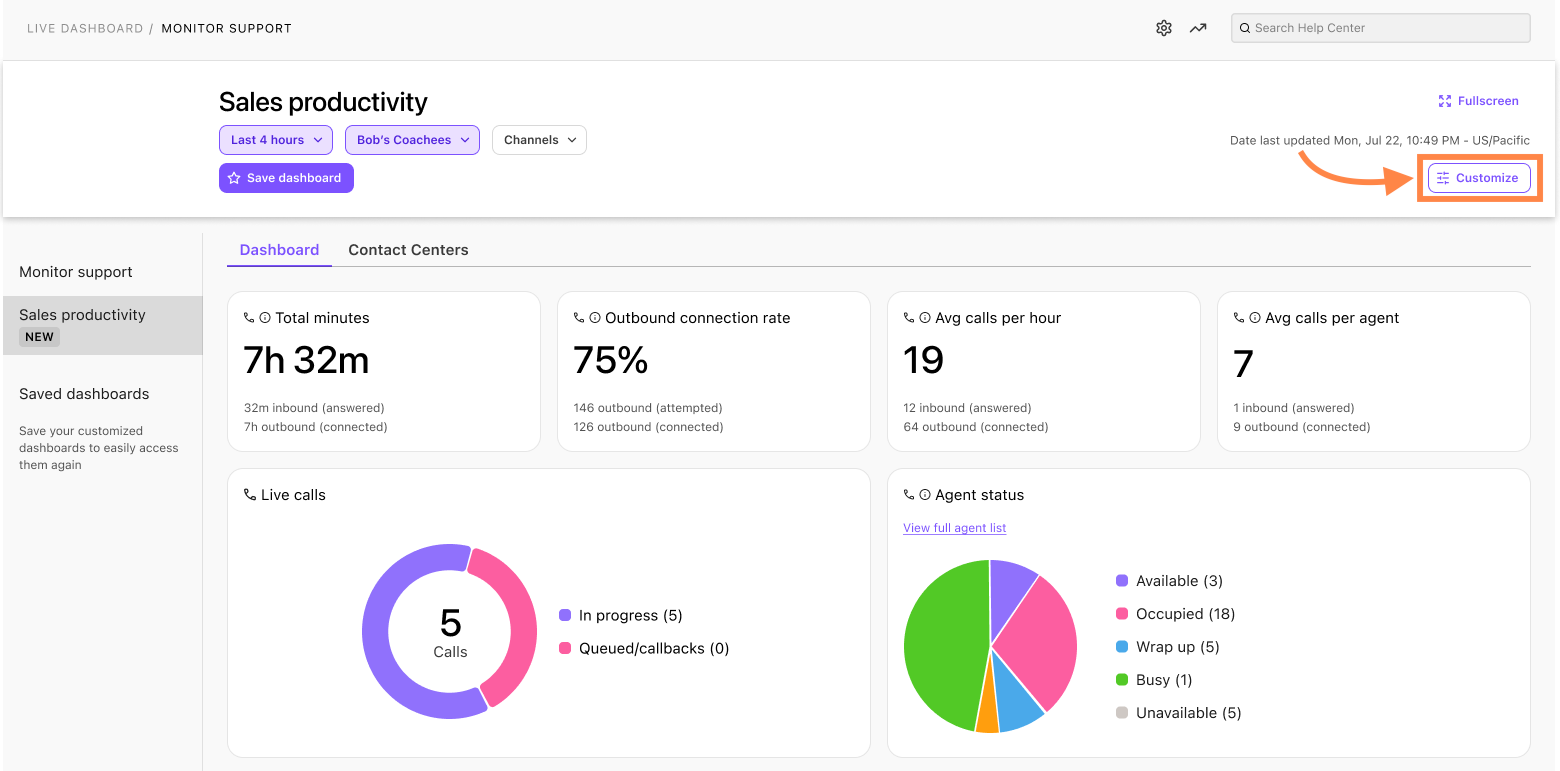
Drag and drop widgets into the desired location
Select the eye icon to hide or display a widget
Select Apply
.png)
Agent Leaderboard for Coaching Teams
The Agent Leaderboard for Coaching Teams helps you understand how individual sellers are performing and how they spend their time.
To customize the leaderboard, select Edit, then use the eye icon to hide or show specific metrics. To sort the leaderboard by a particular metric, select the down arrow in that column header.
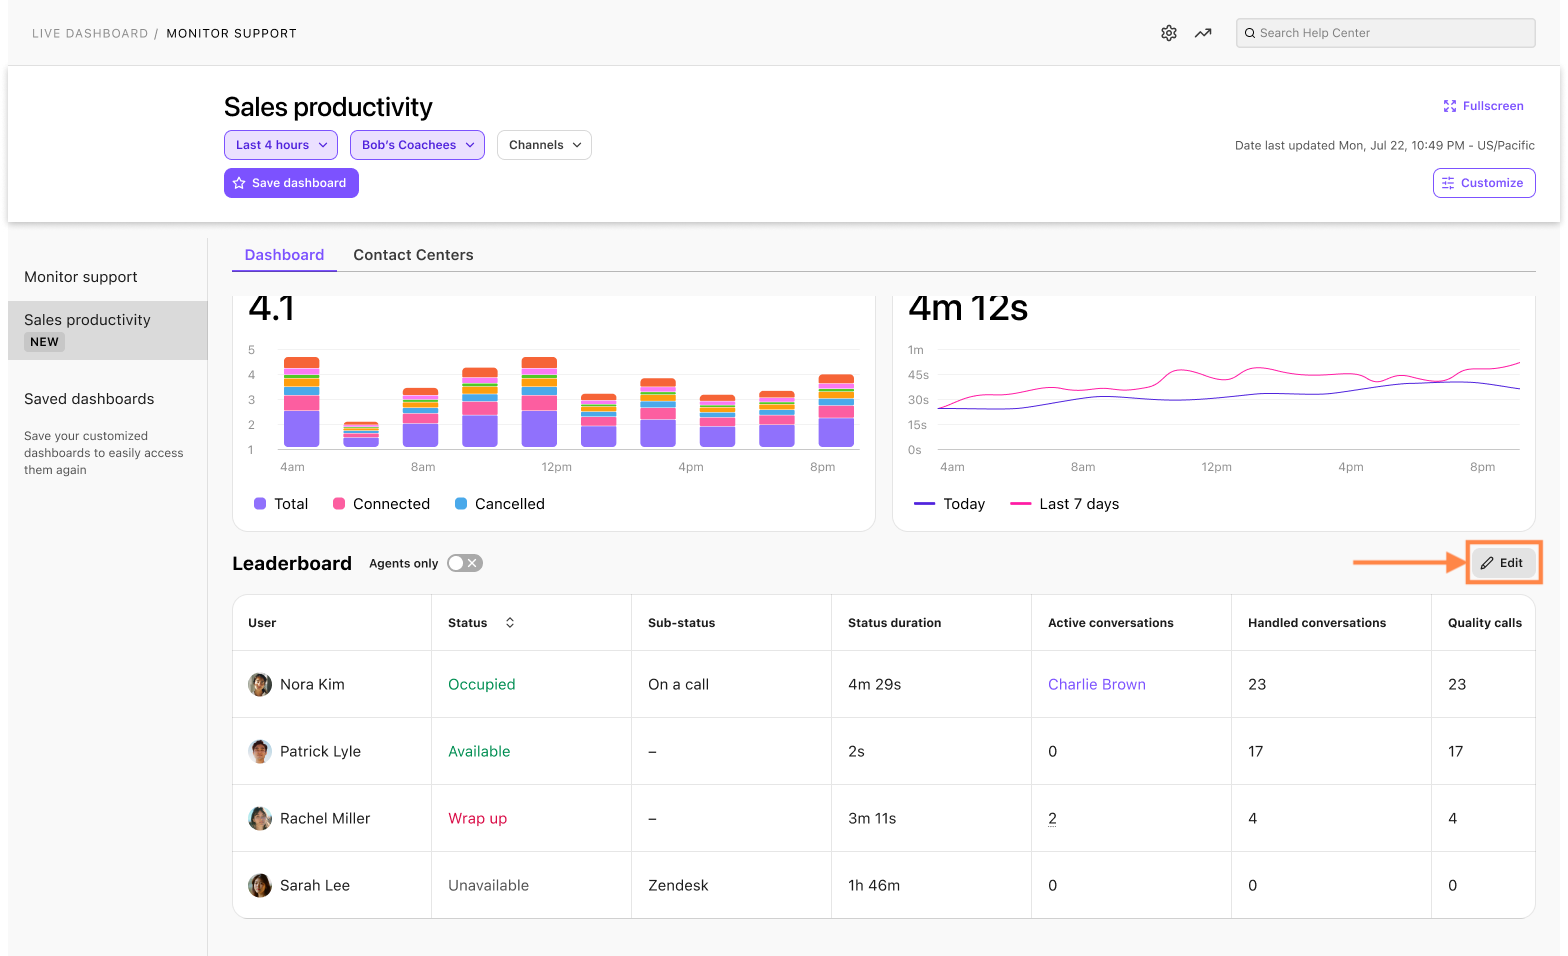
If you only want to view how agents are performing and filter out admins and supervisors, toggle on the Agents only option at the top of the leaderboard.
User | The name of the user. |
Groups | List of groups a user is part of from the selected groups in the target filter. If a user is part of multiple groups and one or more of these groups are selected as the target filter, the name of one of the groups is displayed, and all associated groups for that user will be listed in the column as a tooltip.
|
Status | The agent’s status in their group(s). |
Status Duration | The duration of their status in their group(s). |
Answered | The total number of calls and chats answered. The callback connected count is not included in this value.
|
Minutes | The total number of minutes the agent has been on calls or digital sessions that are connected. |
Average Connected Duration | The average duration of a call in minutes. |
Missed | The number of missed calls or interactions. |
Avg. Talk Time | The average time an agent spends talking on calls. |
Texts | The number of texts the agent has made or received in their contact center(s). |
Outbound Calls | The number of outbound calls initiated by the agent (including completed and canceled outbound calls). |
Wrap-up | The total amount of time the agent has spent in Wrap-up. |
Idle Time | The amount of time the agent has spent as Available (as their global status). |
Callbacks Attempted | The number of callback attempts by the agent. |
Avg. calls per hour | The average number of calls the agent makes per hour. |
Outbound connected rate | The percentage of calls that connect to a live prospect, used to monitor dial efficiency and lead quality. |
Quality calls | Calls lasting over one minute, connecting externally, with multiple voices detected by Dialpad AI, and deemed business-related. |
Calls with dispositions | Call dispositions allow agents to categorize or assign an outcome to every call. |
Avg. playbook adherence rate | The percentage of how well agents or teams follow the guidelines and steps outlined in AI Playbooks during calls. |
Avg. scorecard grade | Average score an agent receives from AI Scorecards |
Transferred Calls | The number of calls transferred to and from another group or extension. |