Understanding performance metrics is key to managing your team’s productivity.
Let’s review the key metrics used in Dialpad WFM’s performance reports and real-time dashboard, helping you track progress, spot areas for improvement, and keep your team on track.
Who can use this
Dialpad WFM is available to all Dialpad users and as a stand-alone product.
Contact your Customer Success Manager to discuss adding Dialpad WFM to your plan.
Adherence
Adherence represents the percentage of an agent’s scheduled time that they spent correctly following their schedule.
Schedule adherence ensures your team maintains the forecasted coverage requirement, while giving you visibility into agent reliability and discipline.
Unlike other tools, Dialpad WFM calculates adherence using real activity data from connected customer service platforms and, for Dialpad customers, uses an agent’s status to confirm whether an agent is actively working or available to receive work.
Adherence is calculated by subtracting the time in adherence from the time scheduled, and multiplying by 100 to produce a percentage.

For example, if an agent is scheduled for 8 hours but spends 1.5 hours out of adherence, their time in adherence is 6.5 hours. To calculate their adherence score, we divide their work time (6.5 hours) by their total scheduled time (8 hours) and multiply by 100. This results in an adherence percentage of 81.25%.
Want to learn more?
Read our dedicated guide to learn more about how Dialpad WFM calculates adherence.
Scheduled Time
Scheduled time measures the amount of time that has been scheduled for the agent(s) selected.
This metric is helpful to add context to other metrics. For example, an agent who was scheduled for more hours will likely close more tickets than an agent who was scheduled for less.
Closed
Closed displays the total number of times agents applied a ‘closed’ status to contacts. This metric is helpful to measure the total output of an agent or team.
This metric will change slightly depending on whether you're viewing the metric per agent or per activity:
When viewing metrics at the agent level, the data is calculated based on the specific agent who closed the ticket.
When viewing metrics at the activity level, the data is calculated based on the type of activity that was closed, regardless of which specific agent was involved.
Note
For Zendesk, "Total closed" = number of "Closed" and "Solved" contacts.
Closed per Queue Hour
Closed per Queue Hour shows an average of how many contacts an agent applied a ‘closed’ status to during each hour they were scheduled to work on queue activities.
This metric provides a clearer measure of productivity by excluding time not scheduled on queues. It's particularly helpful for comparing individual agent performance, as it normalizes for differences in agent schedules.
Closed per Queue Hour is calculated by dividing the number of tickets closed by the number of hours scheduled for queue activities.

For example, an agent’s shift was 8 hours, and 4 hours were scheduled on queue activities. They closed 20 tickets during their shift, so their Closed per Queue Hour score is 5.
Planned Occupancy
Planned Occupancy represents the percentage of time that agents were scheduled on queue activities, excluding time spent on breaks.
This metric helps to give insight into how well agents are utilised on customer facing activities from a scheduling point of view. This metric is only available at an agent level, not an activity level.
Planned Occupancy is calculated by summing the total time scheduled on queue activities and removing the total time scheduled on breaks. Then by dividing this result by the total scheduled hours, and finally multiplying by 100 to get a percentage.
.png)
For example, an agent is scheduled to work 8 hours, with 30 minutes for lunch and two 15 minute breaks. 2 hours are scheduled on internal project work, with the remaining 5 hours scheduled on queue activities.
The planned occupancy calculation would be based on the inputs below:
Total scheduled time: 8 hours
Breaks: 1 hour
Offline activities: 2 hours
Queue activities: 5 hours
The resulting percentage would be:
Planned Occupancy = ( time scheduled on queues / (time scheduled - breaks)) x 100
Planned Occupancy = ( 5 hours / 7 hours) x 100 = 71.4%
In this scenario, the agent's planned occupancy is 71.4%, meaning 71.4% of their scheduled time is scheduled on queue activities.
Actual Occupancy
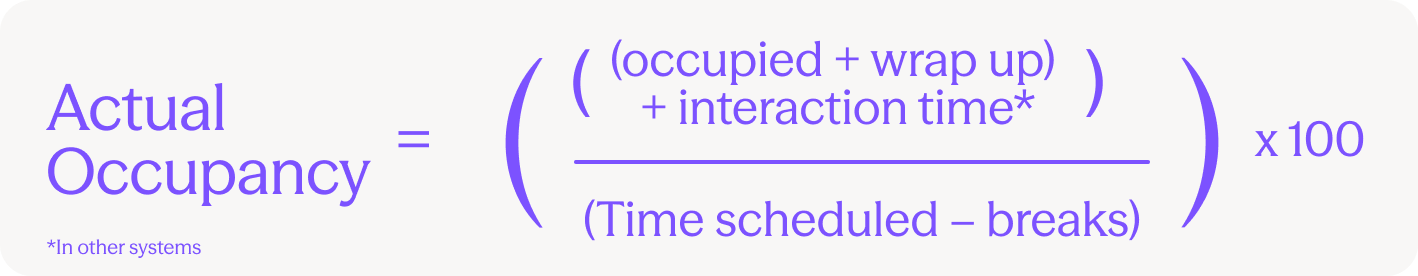
Actual Occupancy represents the percentage of time that the agents were actually engaged with customer contacts, excluding breaks.
This metric is useful to use alongside Planned Occupancy to identify discrepancies between your plan (the schedule) and the operational reality of an agent's behaviour. This metric is only available at an agent level, not an activity level.
Actual Occupancy is calculated by summing the total time agents were in a productive status in Dialpad (occupied and wrap up) and the time spent interacting with contacts. This is then divided by their total scheduled time, excluding breaks, and finally multiplying by 100 to get a percentage.
Availability
Note
This metric is exclusively for Dialpad users.
Availability measures how much of an agent’s scheduled time (excluding breaks) was spent either being ready to take customer contacts or actively handling customer contacts.
It highlights how available the agent was as a percentage of their time scheduled on queues.

For example, an agent is scheduled to work 8 hours (480 minutes) in a day and has 1 hour (60 minutes) of scheduled break. Out of that shift, 4 hours (240 minutes) are scheduled on phones, and the remaining time is set for non-queue activities (Projects and Training).
During those 240 minutes, the agent spends:
120 minutes in Available status (waiting and ready for interactions)
90 minutes in Occupied status (actively handling conversations)
Then, we calculate the Availability percentage:
Add Availability and Occupied time: 120 (Availability) + 90 (Occupancy) = 210 minutes
Subtract breaks from total queue schedule time: 480 (Scheduled time) - 60 (Break) = 420 minutes
Divide the two values, then multiply by 100 to get the Availability percentage: 210 / 240 minutes × 100 = 87.5%
In this scenario, the agent’s availability is 87.5%, meaning they spent most of their phone time ready or actively helping customers. Use this metric alongside actual occupancy to determine if your schedule is overestimating call volumes.
Average Interaction Time (AIT)
Note
This metric is recommended for digital or messaging channels.
Average Interaction Time (AIT) measures the average time agents spent on each interaction.
An interaction is an event related to a contact or conversation. This includes:
Comments: A message that was sent to a customer, or an internal note (for selected systems)
Contact status change: When the status of a contact was changed, e.g. Open → Closed
This metric provides insight into the average time spent on each customer interaction, helping to identify areas for efficiency improvement and better resource allocation.
Average Interaction Time is calculated by dividing the total time scheduled on interactions by the number of interactions.

For example, if an agent handles 20 interactions in a day, spending a total of 400 minutes, the average interaction time would be 20 minutes (400 minutes ÷ 20 interactions).
Average Conversation Time (ACT)
Note
This metric is recommended for digital or messaging channels.
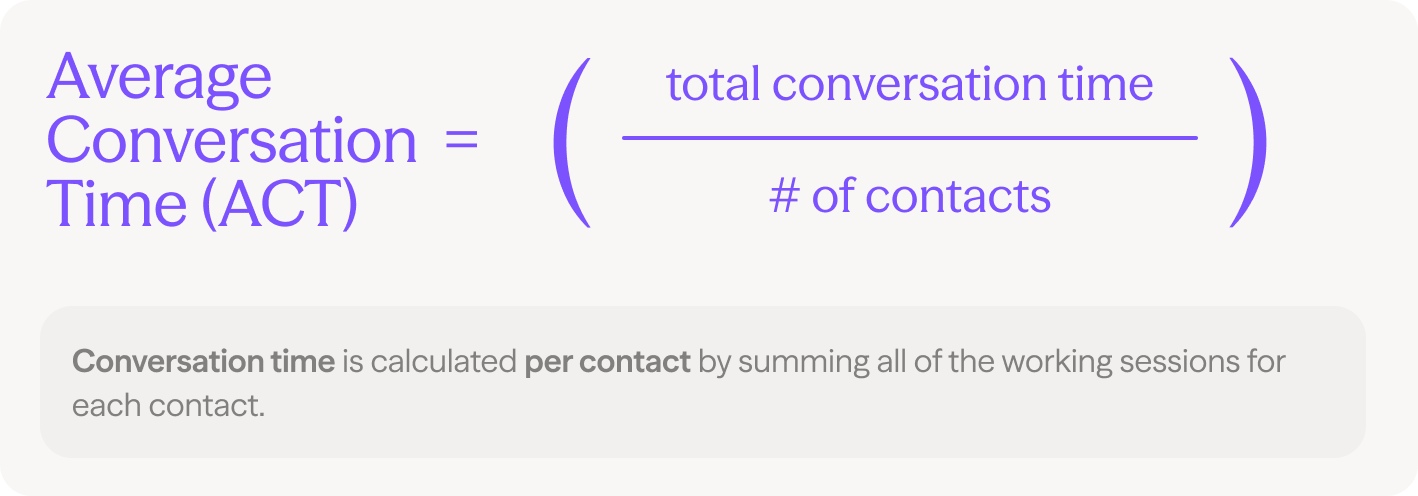
Average Conversation Time (ACT) measures the average active working time spent to close each contact, removing waiting or idle time.
This metric is an alternative to the industry standard of Average Handle Time (AHT).
Traditional methods of measuring AHT often rely on tracking the time from contact creation to closure. While suitable for voice channels, this method can inflate AHT metrics for digital or messaging channels, which may continue asynchronously, as waiting time is included.
To address this limitation, Dialpad WFM uses a more accurate approach that focuses on the actual working sessions agent spent on each contact. This ensures that staffing requirements are based on realistic workload assessments and avoids unnecessary overstaffing.
When we build an activity timeline, we group related interactions on the same contact into working sessions. Once a contact is closed, we sum all of the working sessions to calculate the total conversation time.
For example:
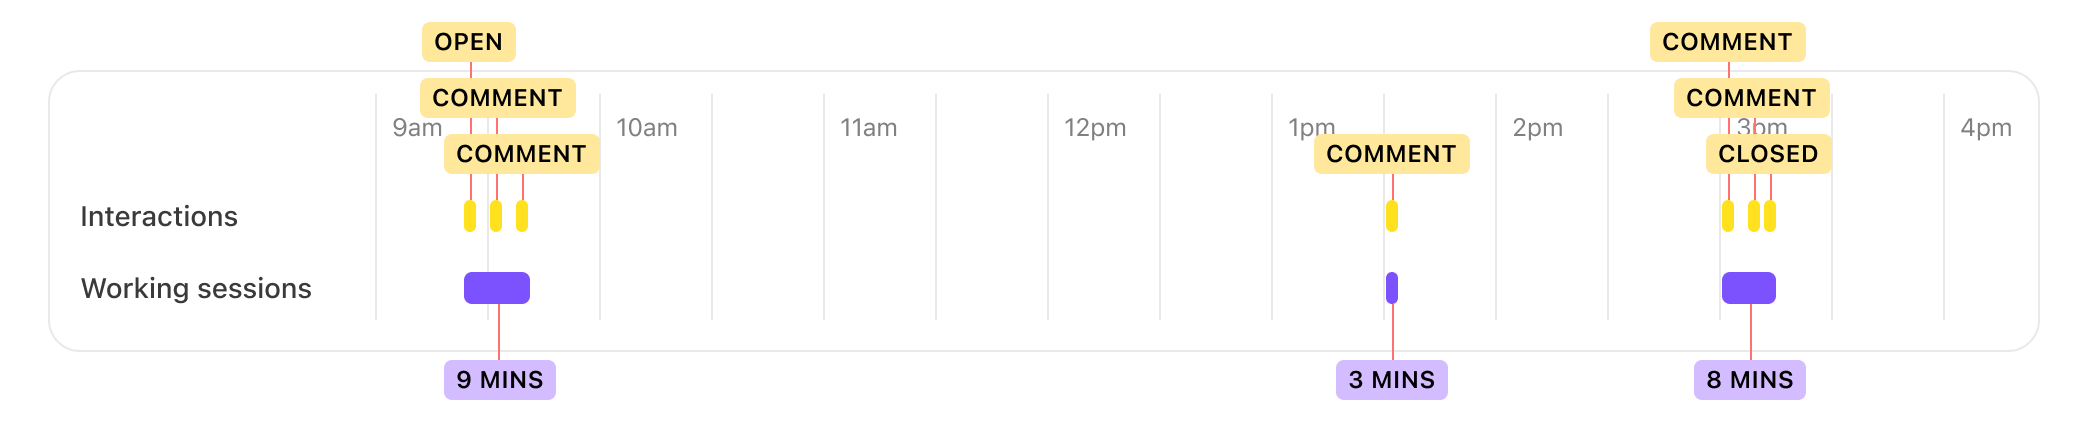
In the morning, Ben is assigned to an open ticket and exchanges 2 messages with the customer. The customer then stops responding. These 3 interactions form 1 working session that lasted 9 mins.
The customer responds again at lunch and Ben responds, but he needs more information from the customer. This single interaction forms a second working session that lasted 3 mins.
In the afternoon, the customer responds and Ben sends 2 messages before closing the contact. This forms a final working session that lasted 8 mins.
The conversation time for that contact is 20mins (9 + 3 + 8). A traditional AHT metric would be calculated as 6 hours and 15 mins (9:10am (open) to 3:15pm (closed)).
The Average Conversation Time is then determined by calculating the average of all closed ticket conversation times within a specific timeframe (e.g., daily, weekly).
Opened
Opened displays the number of times an agent set a contact (e.g. call, email, message) to an Open status.
This metric helps understand how many contacts agents are opening. This metric is available at an agent and activity level.
For Dialpad, answering a call will count as an Open event.
View the relevant integration guide for the details of what counts as an Open event for other integrations.
This metric counts all Open events, not only unique events, which means if the same contact was set to open twice in the same period, it will also be counted twice.
Closed
Closed displays the number of times an agent set a contact (e.g. call, email, message) to a Closed status.
This metric helps understand how many contacts agents are closing. This metric is available at an agent and activity level.
For Dialpad, ending or transferring a call will count as a Closed event.
View the relevant integration guide for the details of what counts as an Closed event for other integrations.
This metric counts all Closed events, not only unique events, which means if the same contact was set to Closed twice in the same period, it will also be counted twice.
Comments
Comments displays the number of times an agent sent a reply, or in some cases left an internal note, on a contact (e.g. email, message).
This metric helps understand how many messages agents are sending. This metric is available at an agent and activity level.
This metric only applies to digital channels, like email, chat or messages. No comment events will be created for calls.
View the relevant integration guide for the details of what counts as a Comment event for each integration.
Frequently asked questions
Which metrics should I use?
Dialpad WFM provides a number of metrics to cover multiple use-cases. Some teams may choose to measure and set targets for all metrics, while others may choose to focus on a smaller subset.
Here are some tips:
Weekly 1:1s: Adherence and Closed per Queue Hour are great metrics to track for weekly performance check-ins. These two metrics can provide insight into the agent’s productivity and skill (Closed per Queue Hour) and discipline (Adherence).
BPO management: When managing BPOs, it’s important to validate they are providing the contracted or required hours, and are delivering the expected output.
Scheduled Hours allows you to see the time scheduled, while Adherence or Actual Occupancy provide deeper insight into the time spent with customers.
Closed and Closed per Queue Hour provide insight into how many contacts the BPO is closing and the speed in which they work. It can be helpful to compare Closed per Queue Hour across in-house and BPO teams to evaluate the effectiveness.
Leadership reports: Often leadership will require more detailed reports into not only the performance of agents, but also how the WFM team are using resources.
Adherence and Closed per Queue provide insight into team productivity and skill (Closed per Queue Hour) and discipline (Adherence).
Scheduled Hours, Planned and Actual Occupancy allow leaders to understand how agent behaviour differs from the scheduled plan, and the impact that can have.
Forecasting: To accurately forecast the number of agents required to meet your SLAs, your productivity assumptions need to be based on real data.
Average Conversation Time (ACT) can be used in queue settings to more accurately estimate the time agents spent on each contact.
For asynchronous queues where forecasts are based on each message within a conversation, Average Interaction Time (AIT) can be used too.
How is adherence calculated?
Adherence is calculated using a mix of Dialpad status and interactions with contacts in integrated CRM or customer service platforms.
Read this article for more information.
Why is Actual Occupancy over 100%?
Actual Occupancy represents the percentage of time that the agents were actually engaged with customer contacts, excluding scheduled breaks.
If an agent then works during their scheduled break, their occupancy will be higher than the time scheduled for queue work, which can produce an Actual Occupancy score of over 100%.
Why is Actual Occupancy different to Adherence?
Although similar, there are some differences between Actual Occupancy and Adherence:
Actual Occupancy measures the percentage of time agents were actually engaged with customer contacts, excluding scheduled breaks.
Adherence measures schedule compliance but includes accommodations for natural workflow transitions, such as a 2-minute grace period after closing contacts and "friendly time" when switching between activities. Learn more
These accommodations mean that even if an agent works on the same task all day, their Actual Occupancy and Adherence scores can be different.
How can I use Average Conversation Time (ACT)?
Average Conversation Time (ACT) provides insight into the amount of time required to close contacts.
By inputting this metric into your queue settings, you can ensure that your forecasts provide adequate staffing requirements to handle the forecasted workload, based on their current productivity.
To use ACT in your queues:
Head to Performance page
Select all your teams, or the teams that work in this queue
Select the Week view
In the breakdown table, select By activity
Select the activities linked to this queue
Note the ACT across the last 4 - 12 weeks
Create an average of these numbers
Navigate to Agent productivity
Enter the ACT value
