Dialpad WFM’s performance report is your go-to for all your team's WFM performance data, giving you the insights you need on their adherence, occupancy, availability and productivity.
This report can help you identify areas to improve, validate if resources are being used efficiently, and highlights where your team may need additional support to do their best work.
Let’s dive into the details.
Who can use this
Dialpad WFM is available to all Dialpad users.
Contact your Customer Success Manager to discuss adding Dialpad WFM to your plan.
Set up performance reporting
To use performance reports within Dialpad WFM, admins will first need to complete the following steps:
Set up performance-ready integrations into your CRM or customer service platforms
Link queues to customer facing activities
Create and publish schedules
Visit our set-up guide for step by step guidance.
Access performance reports
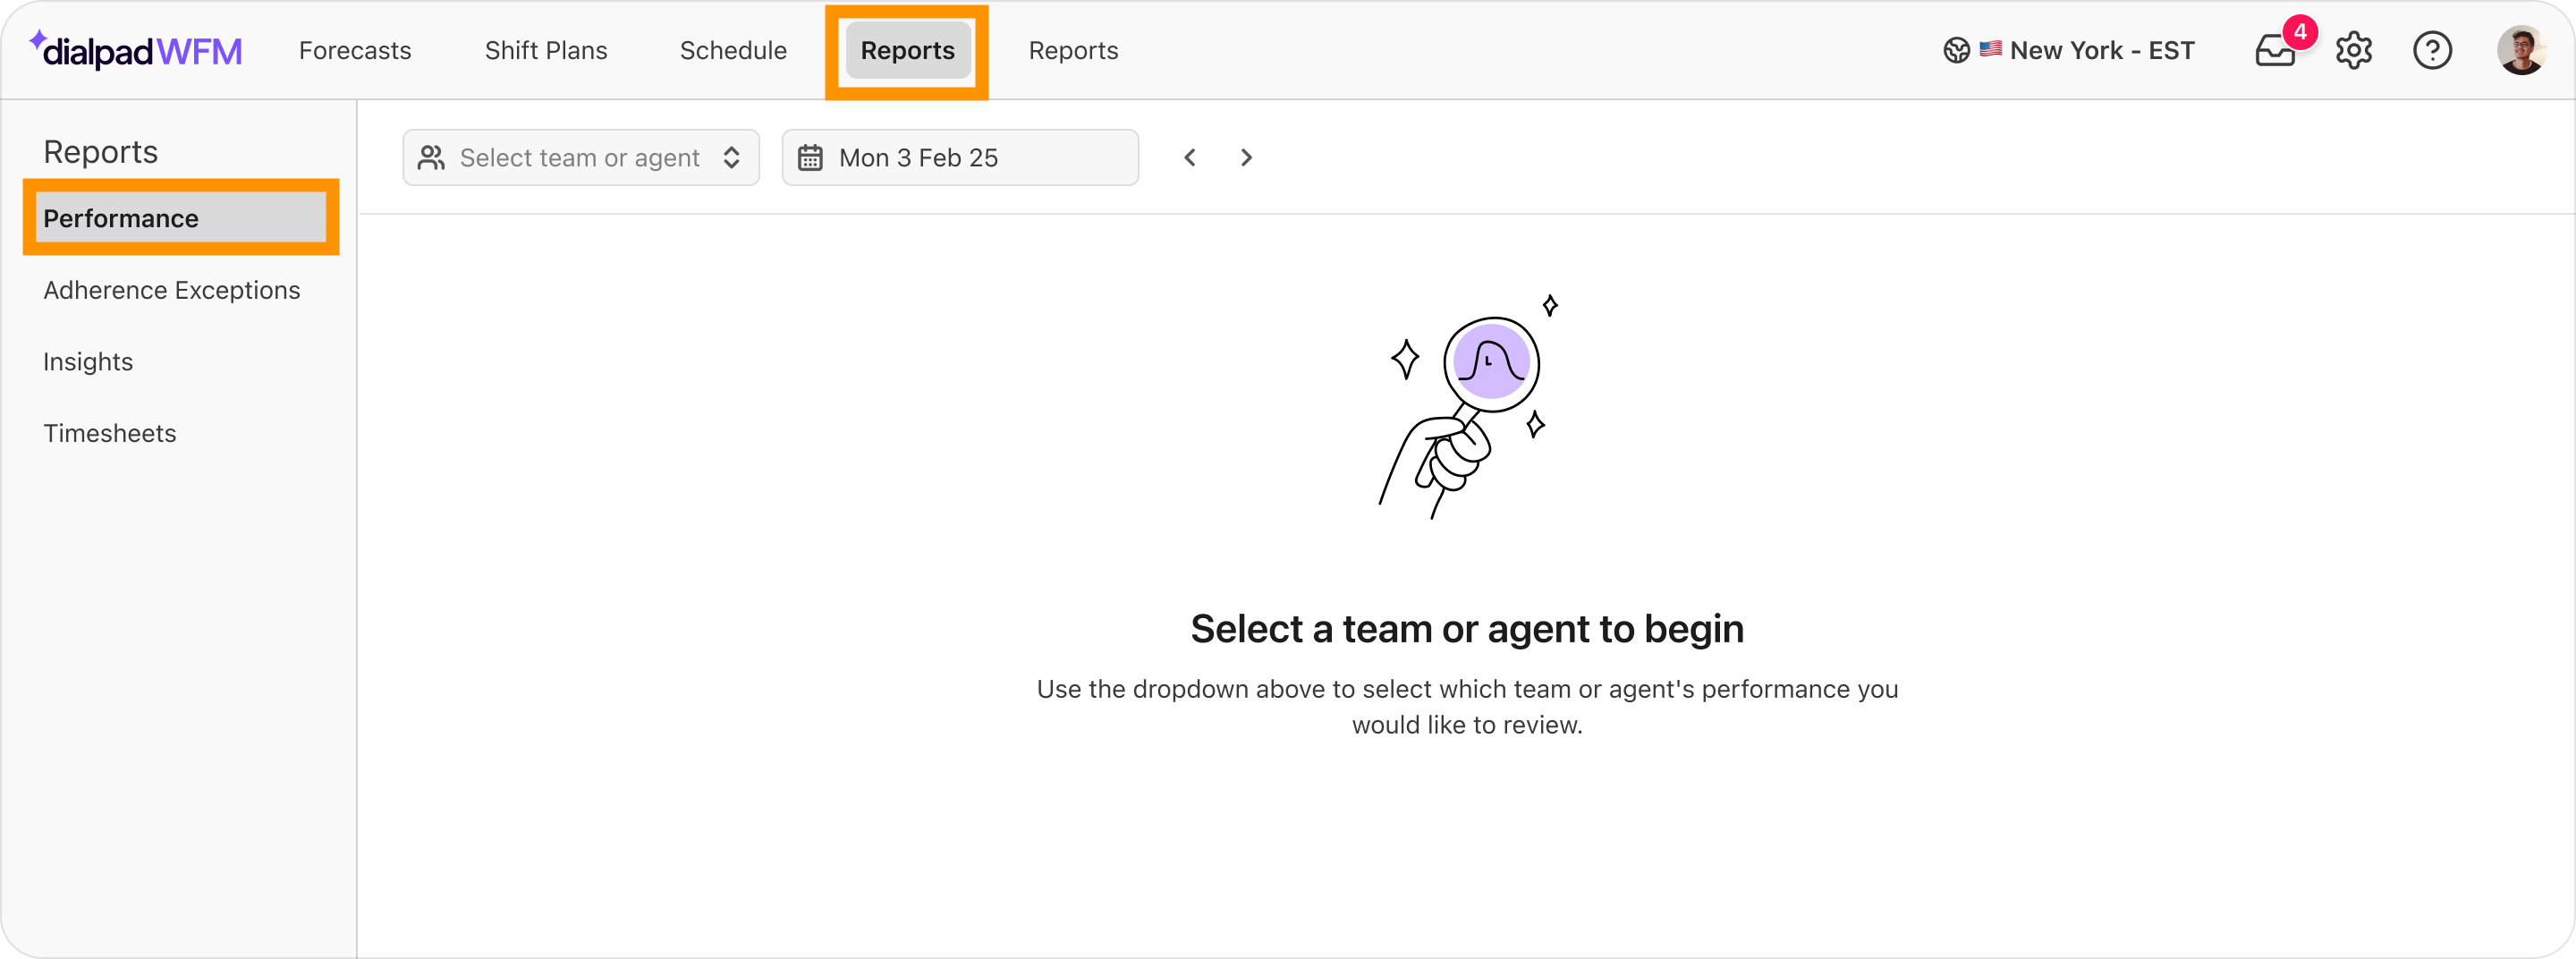
Performance reports can be accessed by all Dialpad WFM admins. To access performance reports, go to Dialpad WFM.
Select Reports
Select Performance
Are you an agent?
If you’re an agent, select Performance in Dialpad WFM to view your performance report. Agents can only view their own data, not their colleagues.
View reports
Use the filters at the top of the Performance page to view reports for different teams and agents for different periods of time.
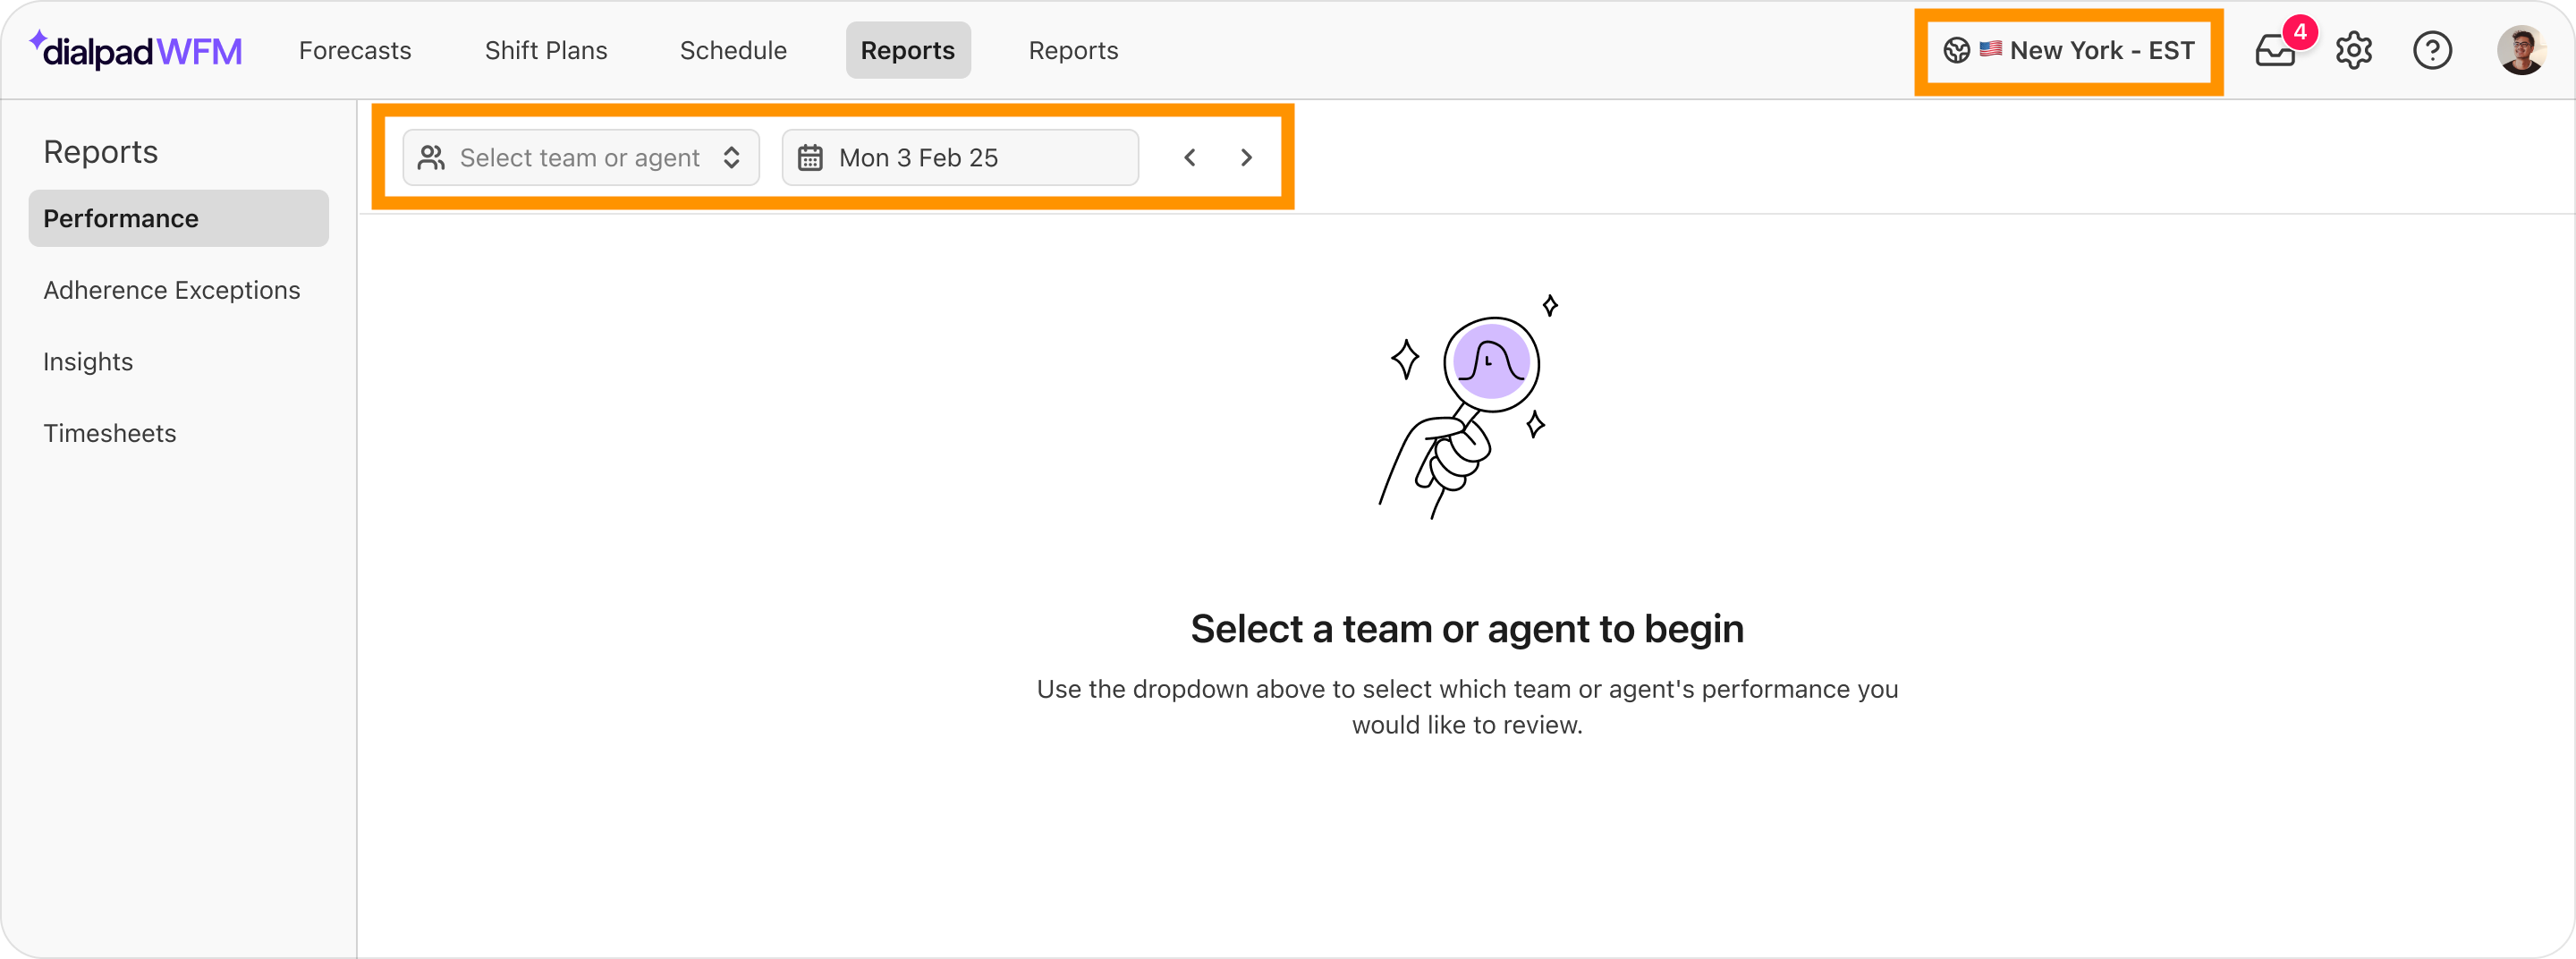
You can filter by:
Agents or team(s): Select specific team(s) or agent(s).
Date range: Displays data for the selected date range. You can select from 1 to 32 days.
Select Today to jump to today and view real-time data.
Use the left and right arrows to move forwards or backwards in time.
Tip
Use the global timezone picker in the top navigation bar to view reports in different timezones.
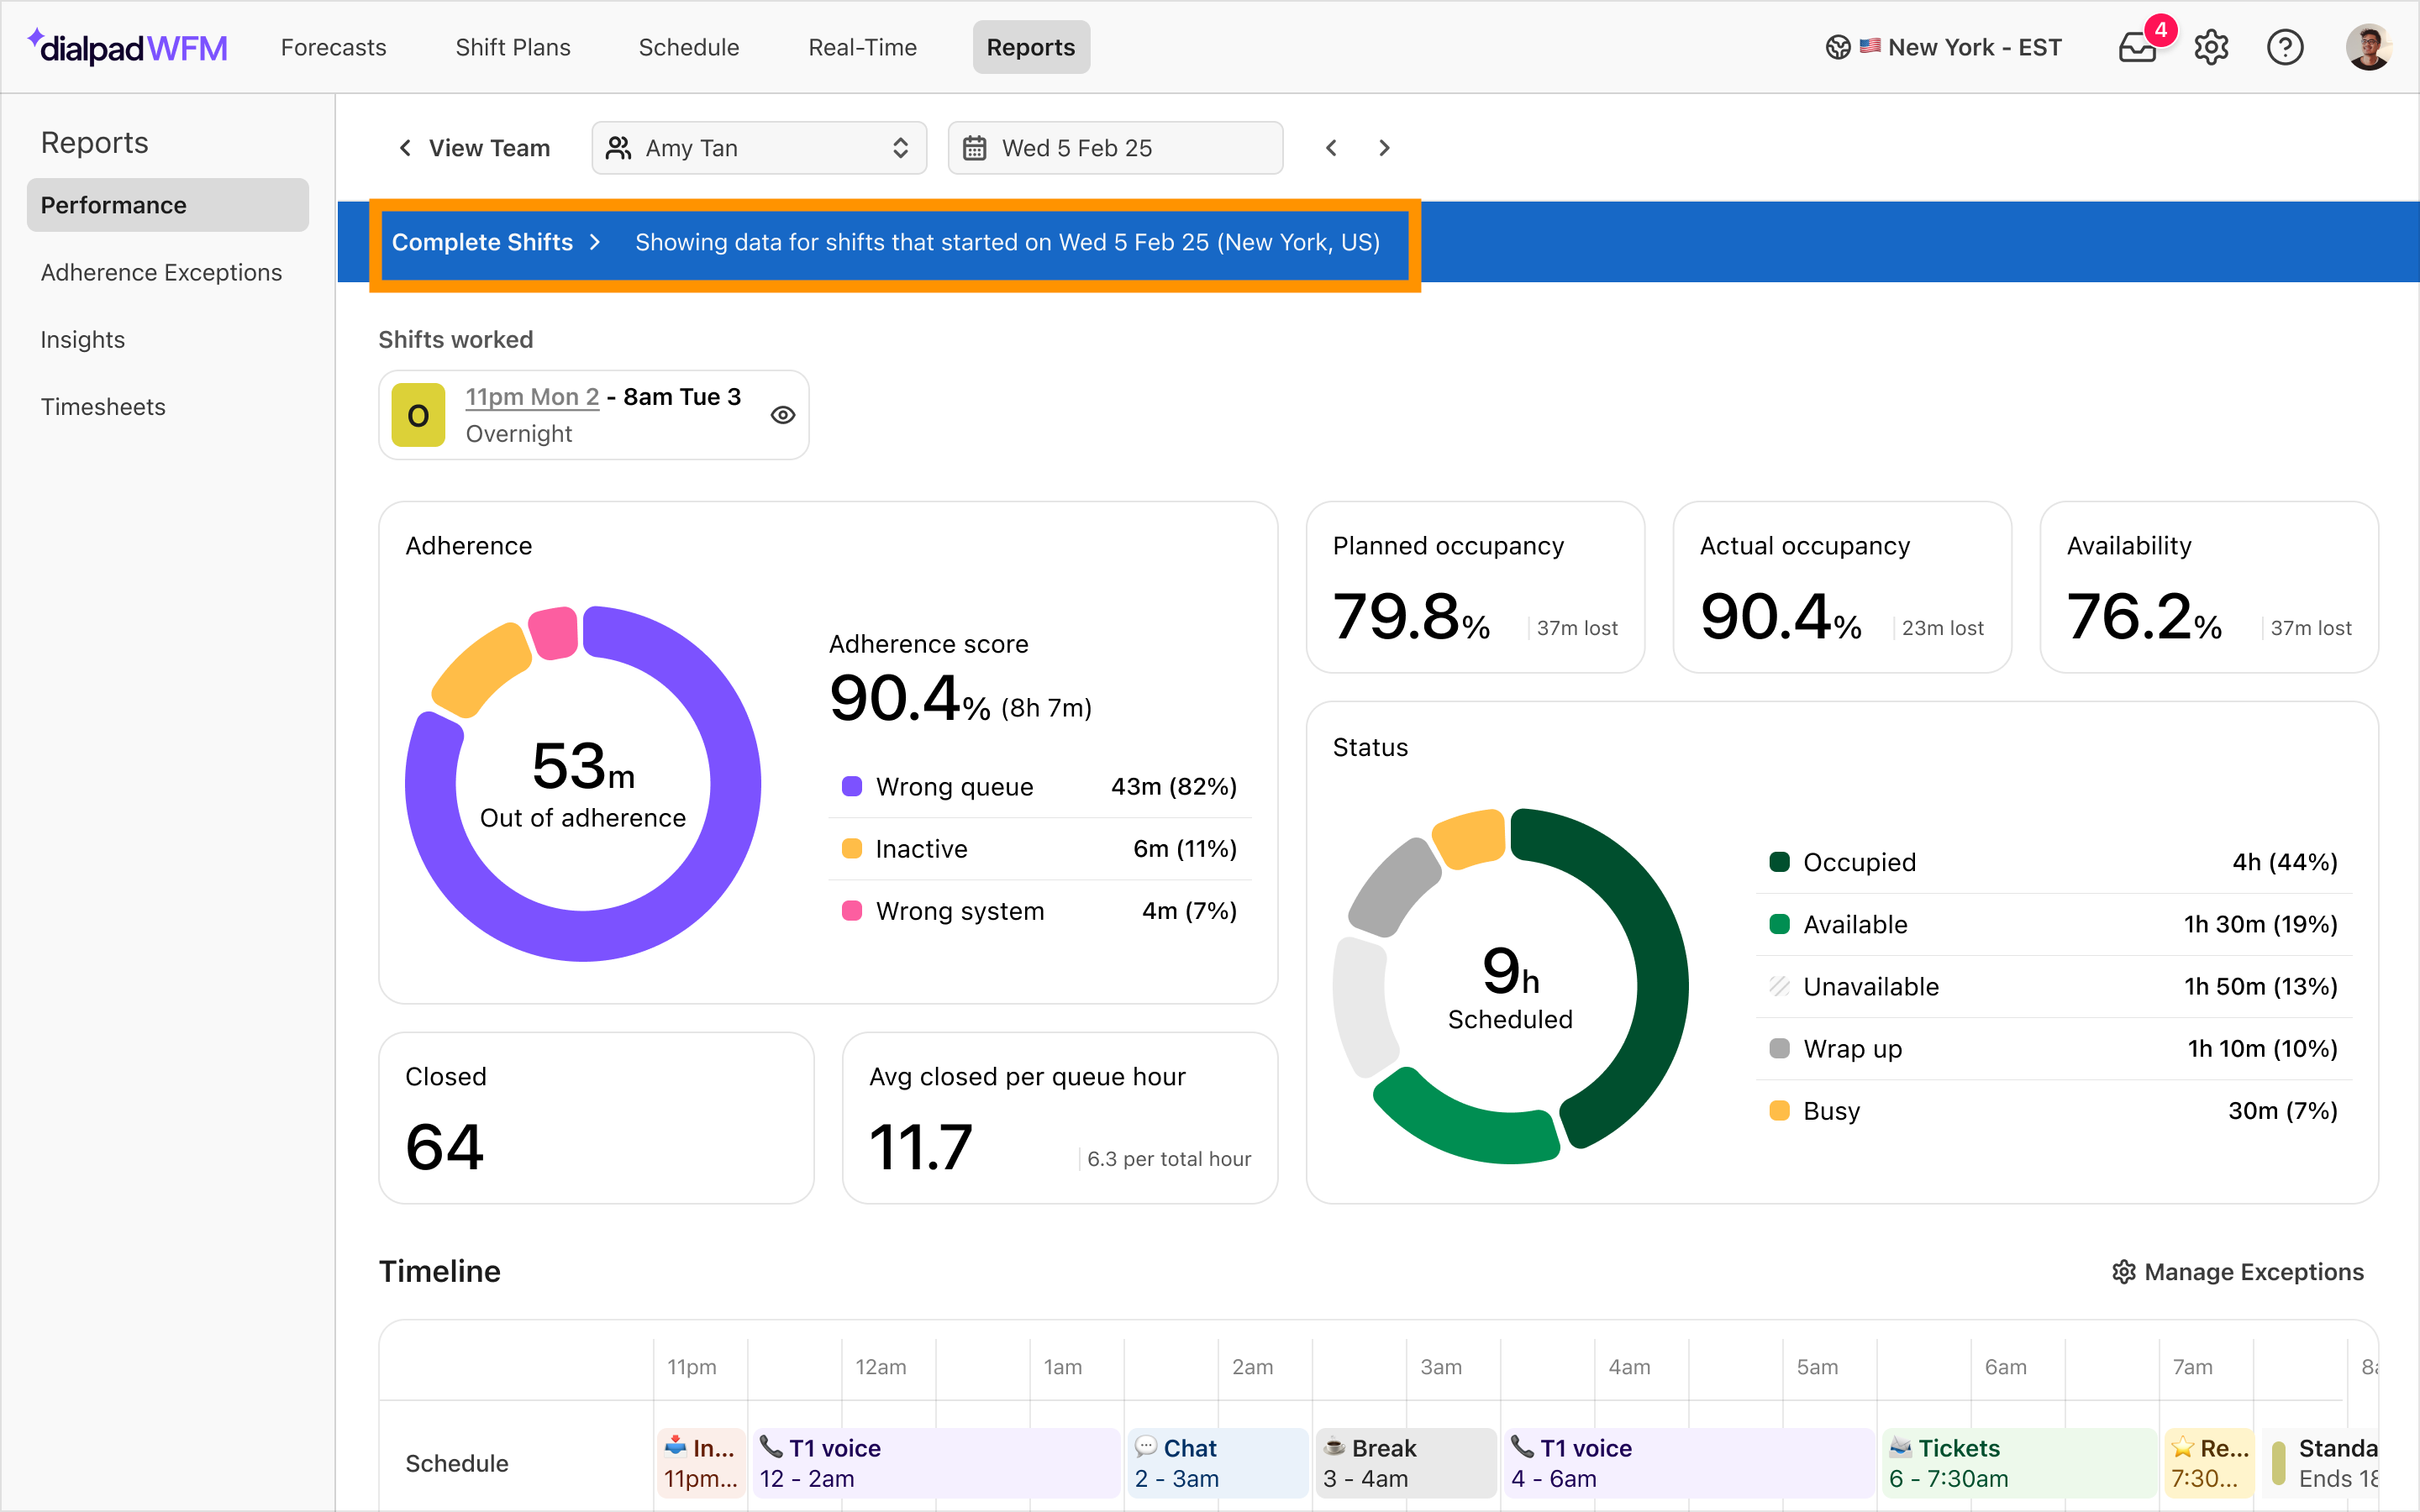
View reports for calendar days or complete shifts
By default, all reports will be shown in calendar days. When viewing data for a single agent on a single day, you can also choose to view data for complete shifts, too.
From the blue bar at the top of the page, you can select:
Calendar days: Shows all data between 0am - 11:59pm for the selected day in the chosen timezone. Any scheduled hours that fall outside of this window, such as an overnight shift, will not be included in the report. When this happens, the affected start or end time will be highlighted.
.png)
Complete shifts: Show data for shifts that started on the selected day in the chosen timezone. In this view, you can view the entirety of overnight shifts, and choose to focus in on individual split shifts.
Hero metrics
Hero metrics display key data points and visualizations of agent performance. Refer to our metrics definition article for more information.
.png)
Productivity metrics:
Closed: Displays the total number of times agents applied a ‘closed’ status to contacts.
Closed per queue hour: Shows an average of how many contacts agents applied a ‘closed’ status to during each hour they were scheduled to work on queue activities.
Time metrics:
Scheduled time: Measures the amount of time that has been scheduled for agents.
Adherence: Represents the percentage of an agent’s scheduled time spent correctly following their schedule, including any out-of-adherence (OOA) reasons and the time lost to each one.
Wrong queue - Showing agent activity i.e. working, but in the wrong queue.
Inactive - No activity and in the unavailable status.
Wrong status - No activity and in the wrong status (including exceptions).
Wrong system - Showing agent activity but in the wrong system (e.g. expected in Dialpad but working in Zendesk).
Planned occupancy: Represents the percentage of time that agents were scheduled on queue activities, excluding time spent on breaks.
Actual occupancy: Represents the percentage of time that the agents were actually engaged with customer contacts, excluding breaks.
Availability: Measures how much of an agent’s scheduled time (excluding breaks) was spent either being ready to take customer contacts or actively handling customer contacts.
Note
The Availability metric is only visible for Dialpad users.
Activity timeline
Note
The Activity Timeline is only visible in reports for individual agents on single days.
Activity timelines provide a visual, interactive overview of the agent’s shifts, giving you a clearer picture of their productivity and adherence.
Activity timelines can generate a huge amount of insight into agent behaviour. You can see when agents were idle, calls overran into breaks, as well as tardiness and inactivity.
Schedule
Displays the agent’s published schedule for that day.
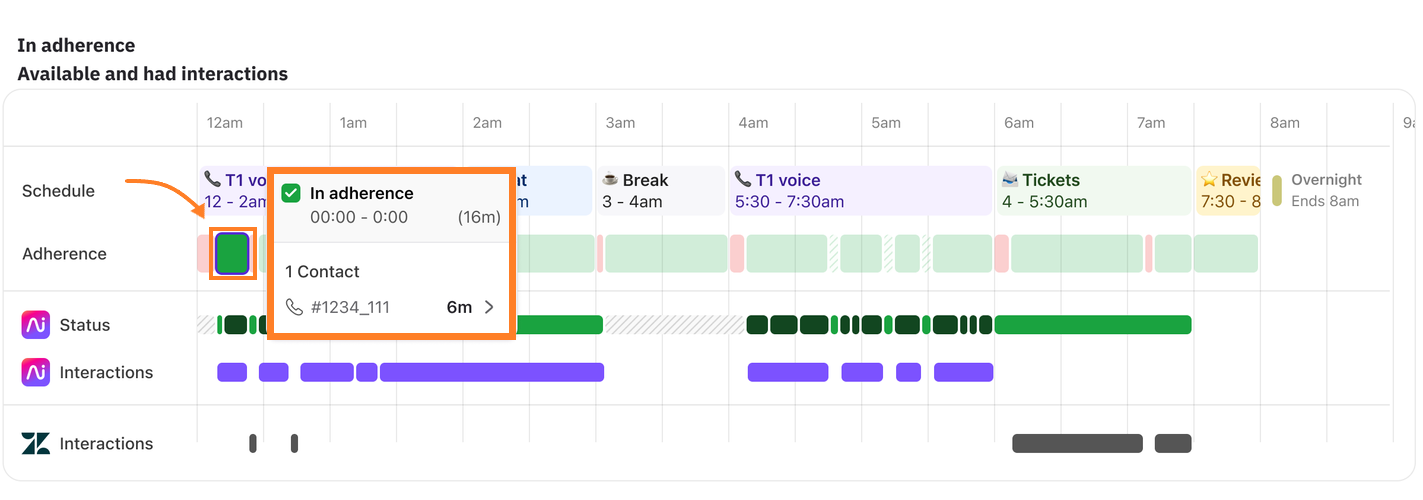
Adherence
Displays where the agent was in or out of adherence.
Green: In adherence
Green hashed: In adherence (exception)
Red: out of adherence
Hover over blocks in this row to view why the agent was marked as in or out of adherence, including their status and interactions.
Status (Dialpad exclusive)
Displays the agent’s different Contact Center status’.
Light green: Available
Dark green: Occupied
Yellow: Busy
Light gray: Unavailable (including any custom unavailable status)
Dark gray: Wrap up
Hover over blocks in this row to view the agent’s Contact Center status, including the custom Unavailable status.
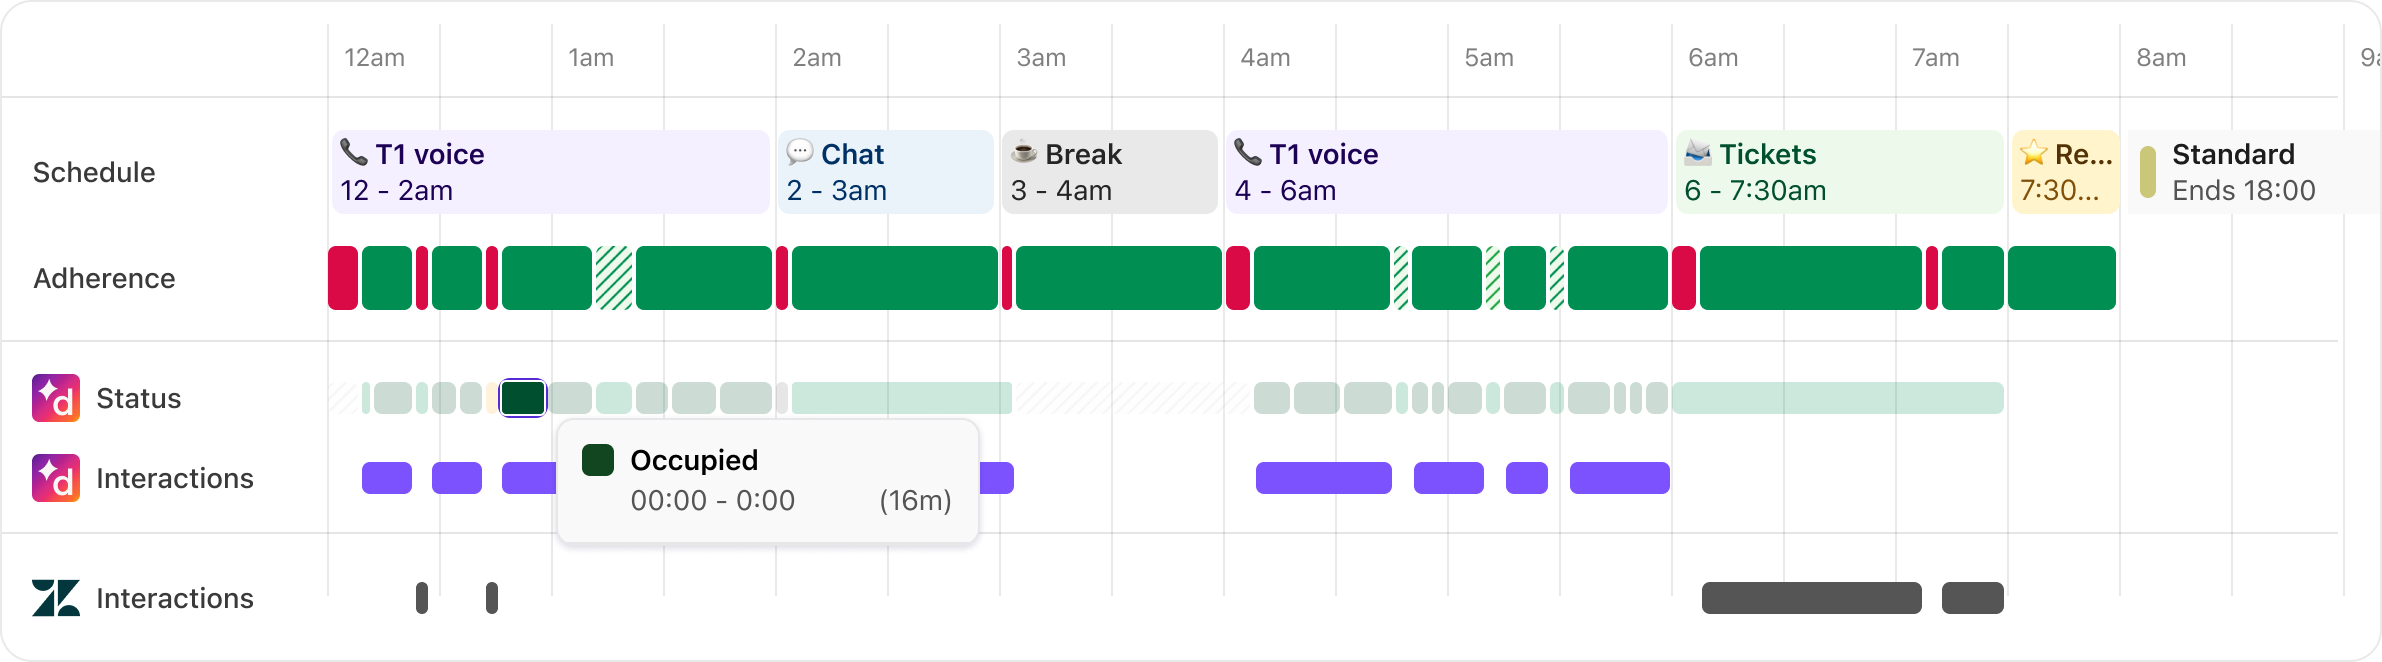
Interactions
Displays when the agent was handling a customer interaction (e.g. on a call, opened or closed a chat). A row will be displayed for each active CRM or customer service integration.
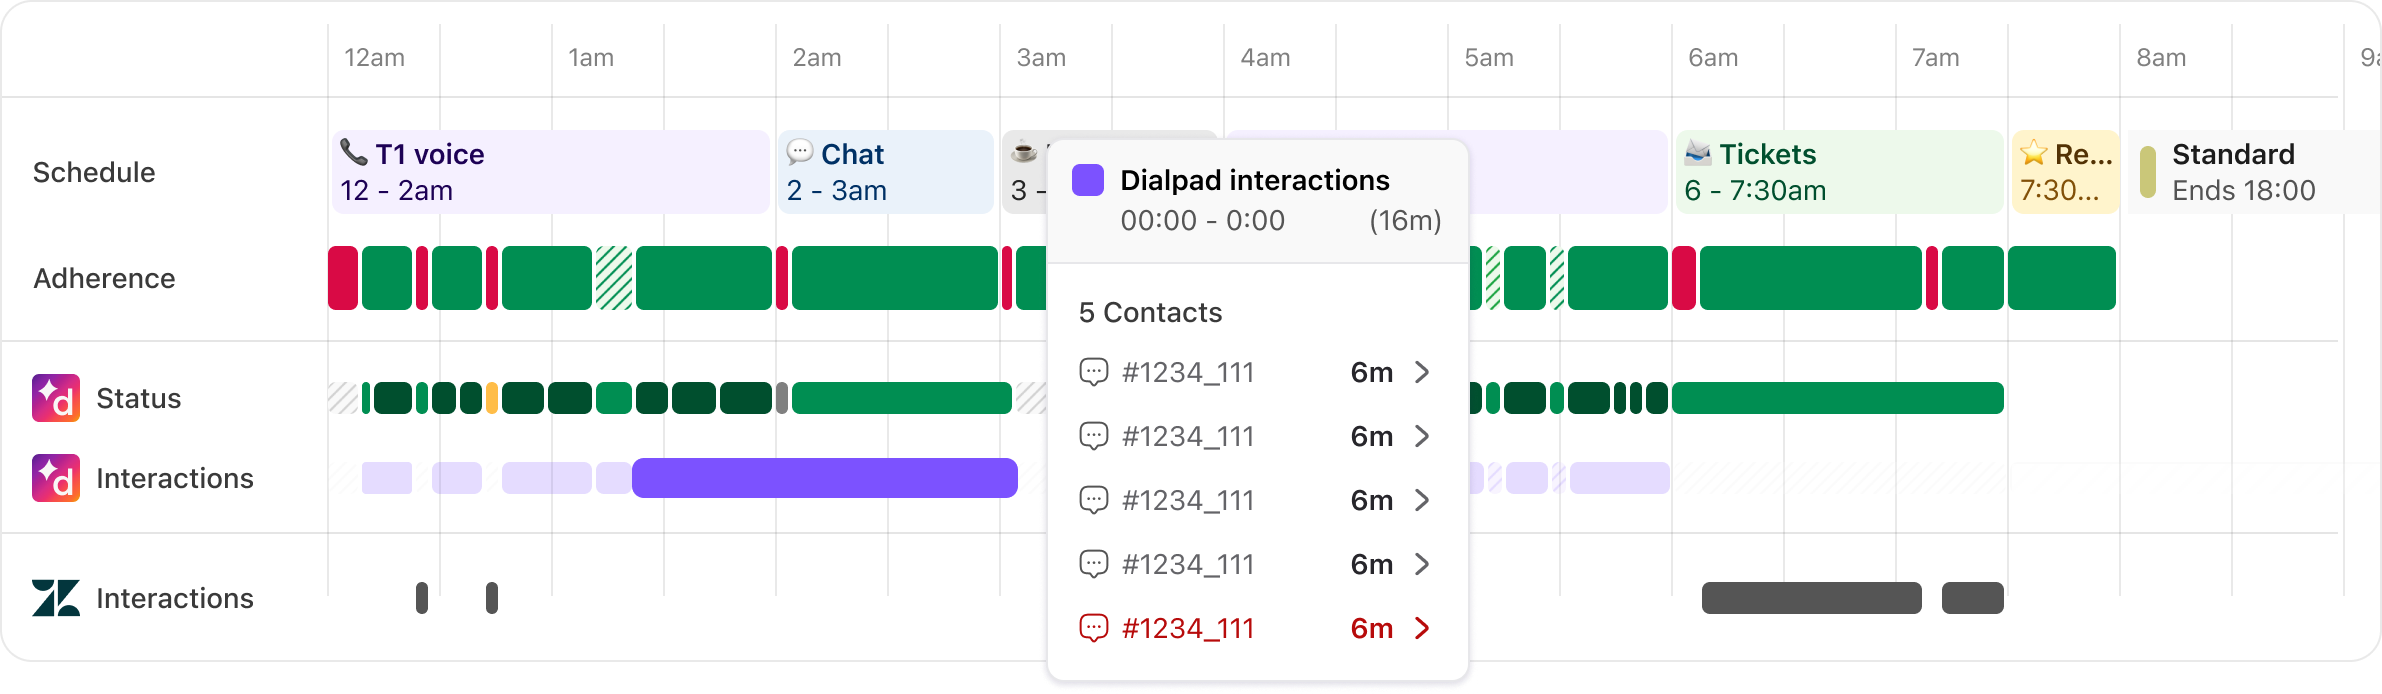
Hover over blocks in this row to view the specific contacts the agent interacted with. Select a contact to see:
The ID of the contact in the relevant system, and a direct link to open and view it, if available.
The length of the working session, i.e. total time the agent spent working on this contact at this time.
A breakdown of each interaction the agent had with this contact, e.g. open, on-hold, comment, closed
The actual or assumed start and end time of the working session.
Learn more about how timelines are built
Read this article to learn more about how working sessions and Adherence is calculated.
Breakdown table
The breakdown table provides a granular view of key performance metrics for each agent or activity.
When viewing reports for single agents, the table will display their performance data for each activity.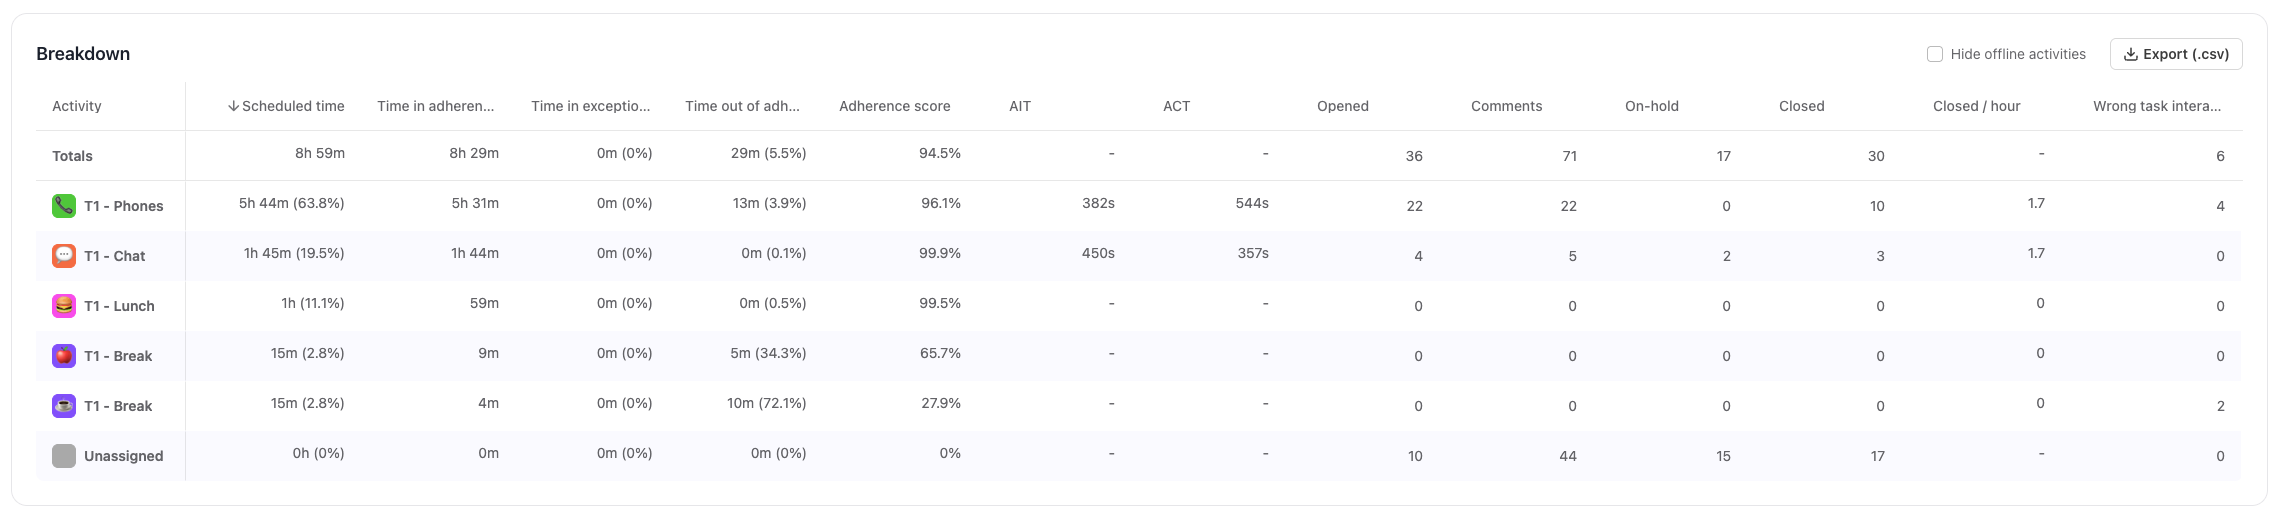
The table will display:
Scheduled time: Total time scheduled for the activity.
Time in adherence: The total time an agent followed their scheduled activity as planned.
Time in exceptions: The total time an agent spends working outside their scheduled activity, such as switching between tasks or systems with an approved exception.
Time out of adherence: The total time an agent spends working outside their scheduled tasks.
Adherence: The percentage of scheduled time an agent spent working on their assigned activity.
Opened: Number of open interactions.
Comment: Number of comment interactions.
On-hold: Number of on-hold interactions.
Closed: Number of closed interactions.
Closed per service hour: The average number of contacts closed per hour scheduled on this queue.
Wrong task interactions: Number of interactions that are either completed during the scheduled activity but do not belong to one of the linked queues for that activity, or are interactions that took place but were not expected during that schedule block, e.g., taking calls during a break.
Unassigned: A “catch all” for all conversations or interactions that were worked but do not align to a scheduled activity.
When viewing reports for multiple agents or teams, the table will display performance per agent and per activity.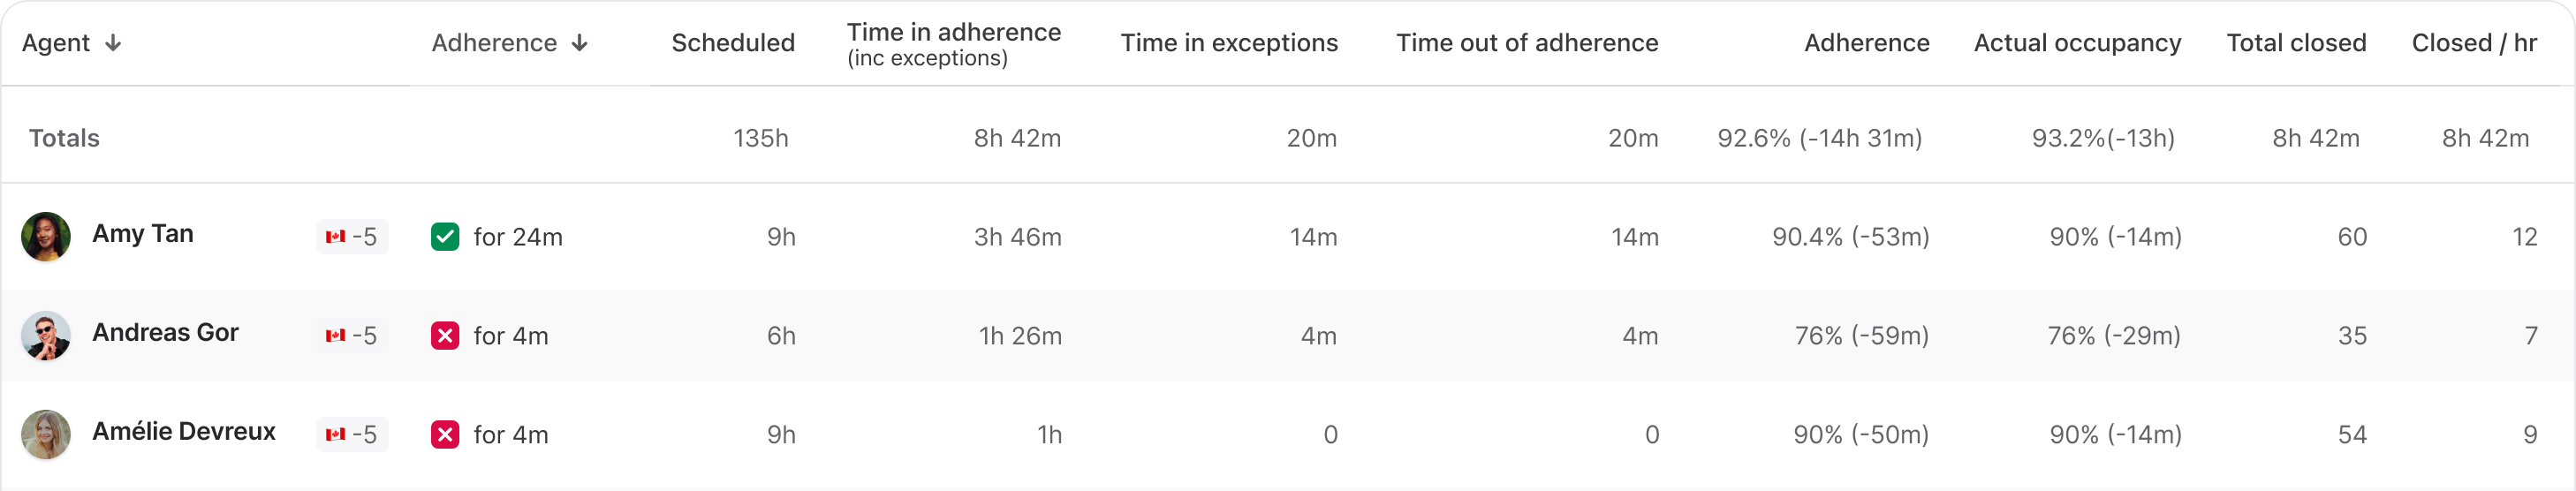
Tip
Sort the table by specific metrics to spot under-performers and over-performers, or filter to find and compare agents by specific scores.
(1).png)
Frequently asked questions
When should I use performance reports?
Dialpad WFM provides a number of metrics to cover multiple use-cases. Some teams may choose to measure and set targets for all metrics, while others may choose to focus on a smaller subset.
Here are some tips:
Weekly 1:1s: Adherence and Closed per Queue Hour are great metrics to track for weekly performance check-ins. These two metrics can provide insight into the agent’s productivity and skill (Closed per Queue Hour) and discipline (Adherence).
BPO management: When managing BPOs, it’s important to validate they are providing the contracted or required hours, and are delivering the expected output.
Scheduled Hours allows you to see the time scheduled, while Adherence or Actual Occupancy provide deeper insight into the time spent with customers.
Closed and Closed per Queue Hour provide insight into how many contacts the BPO is closing and the speed in which they work. It can be helpful to compare Closed per Queue Hour across in-house and BPO teams to evaluate the effectiveness.
Leadership reports: Often leadership will require more detailed reports into not only the performance of agents, but also how the WFM team are using resources.
Adherence and Closed per Queue provide insight into team productivity and skill (Closed per Queue Hour) and discipline (Adherence).
Scheduled Hours, Planned and Actual Occupancy allow leaders to understand how agent behaviour differs from the scheduled plan, and the impact that can have.
Forecasting: To accurately forecast the number of agents required to meet your SLAs, your productivity assumptions need to be based on real data.
Average Conversation Time (ACT) can be used in queue settings to more accurately estimate the time agents spent on each contact.
For asynchronous queues where forecasts are based on each message within a conversation, Average Interaction Time (AIT) can be used too.
How live is performance data, and how often are the reports updated?
Performance reports for today’s date are updated in real-time, as new data is received.
For Dialpad, data latency is >1 minute.
For other providers, data latency is usually 2 - 5 minutes.
Help Scout and Talkdesk latency can be as high as 15 minutes, due to API limitations.
Past performance reports and metrics will be recalculated each time an agent’s schedule is republished, for example, an admin may want to retroactively update an agent’s schedule to reflect a change. This recalculation can take up to 5 minutes.
How is adherence calculated?
Adherence is calculated using a mix of Dialpad status and interactions with contacts in integrated CRM or customer service platforms.
Read this article for detailed information.
Why are agents marked as out of adherence when they’re working?
If agents are marked as out of adherence when they are working, then you may not have linked the correct queue to the activity.
To link a queue to an activity:
Navigate to Schedule > Activities
If it’s not already open, open the editing toolbar by selecting the open button in the top left corner of the schedule
.png)
Navigate to an activity > select the Edit button
Toggle on the link to queue option and select the correct queue from the dropdown menu
(1).png)
Select Save
You can update past performance reports by publishing the relevant periods of the schedule again.
Can I add exceptions so agents aren’t penalised for doing other work?
Yes, Dialpad WFM allows you to create exceptions to account for work outside of primary queues.
For example, if phone lines are quiet, agents may work on the email backlog. You can create an adherence exception for this to allow agents to be proactive without penalising their adherence score.
Learn how to create an adherence exception
Can I view performance for a specific shift?
To view the performance for a specific shift, rather than a specific day, head to the the Performance page in Reports.
Select the agent from the dropdown menu
Select the day and date in the date picker
The shifts this agent was scheduled to work on will be shown at the top of the report
Select the shift you want to view and the page will update to only show data for this shift
Can I export performance data?
Yes, performance data can be exported via CSV or API. Read this Help Center article for detailed instructions.
Why is no data showing up for an agent?
Dialpad agent’s WFM accounts are synced with the Dialpad accounts. But, for standalone customers, we use email addresses to match the agents in your CRM os customer service platforms to their Dialpad WFM profile.
If data is not appearing for an agent, check that agent’s email in Dialpad WFM is the same as in your CRM os customer service platforms
For example, say an agent has an email jane-doe@email.com in Dialpad WFM and janedoe@email.com in your ticketing system. Even tiny changes, like a missing hyphen or character, can cause the system to have trouble matching the accounts.
Occasionally, teams may use alternative email addresses to keep their inboxes private and secure.
If you need to update the agent’s Dialpad WFM email contact Customer Care for assistance.
Why does it say an agent had no shifts, when they did work?
Performance reports only display data for days agents have a published shift. If you are seeing the message, “[Agent] had no shifts on this day”, on a day an agent did work, then check that you have published the schedule for that date. A report will be generated after you publish a schedule.
Why don’t the numbers in the breakdown table add up to the total?
Dialpad WFM uses rounding to simplify how metrics are presented.
Occasionally, this may make it appear that metrics in the breakdown table don’t add up to the total. Dialpad WFM uses the raw data to calculate summaries, so rest assured it is still correct.
Do you track status?
Dialpad WFM only tracked agent’s Dialpad Contact Center status. Status is not yet supported for any other integrations.
For all other integrations, Dialpad WFM will evaluate an agent’s adherence based on their interactions.
Do you track when agents open or view tickets?
Dialpad WFM can only track when an agent sends a comment or changes the status of a contact (open, on-hold, or closed).
Data is not collected when agents open the URL of a contact or view the contact. Dialpad WFM uses ACT to estimate the time the agent spent viewing or working on a ticket before or after the status of the contact changed.
What happens if an agent works outside of their scheduled shift?
If an agent works outside of their scheduled shift hours (e.g. they start work early to finish work late) their interactions and Dialpad status will still be tracked and displayed in the timeline, but the majority of their metrics will not be affected.
The following metrics will not be affected: Adherence, Planned Occupancy, Actual Occupancy, Availability. Closed per Queue Hour
'Closed' will count all 'closed' events for the viewed period. However, if the report is filtered to view a single shift, any 'closed' events outside of the shift won't be counted towards this metric.
What does assumed start and assumed end mean?
When viewing a contact in the Activity Timeline, Dialpad WFM will display the assumed start and assumed end time of the working session for that contact.
This is the time that the agent was assumed to start or end their working session based on the first and last interaction in that session.
Dialpad WFM only receives data when an agent sends a comment or changes the status of a contact (open, on-hold, or closed), it does not receive data when an agent views the URL of a contact.
Dialpad WFM uses the ACT or AIT of the queues linked to the scheduled activity to estimate the time the agent spent on the contact before the comment was added or status of the contact was changed. Learn more about adherence logic in this article.