The Insights page in Dialpad WFM helps you analyze team capacity and scheduling efficiency by tracking time off, utilization, and areas for improvement.
This allows you to review historical performance or plan ahead with actionable insights into team allocation and workload management.
Let's dive into the details.
Who can use this
Dialpad WFM is available to all Dialpad users.
Contact your Customer Success Manager to discuss adding Dialpad WFM to your plan.
Access the Insights page
To access the Insights page, head to Dialpad WFM.
Select Reports
Select Insights

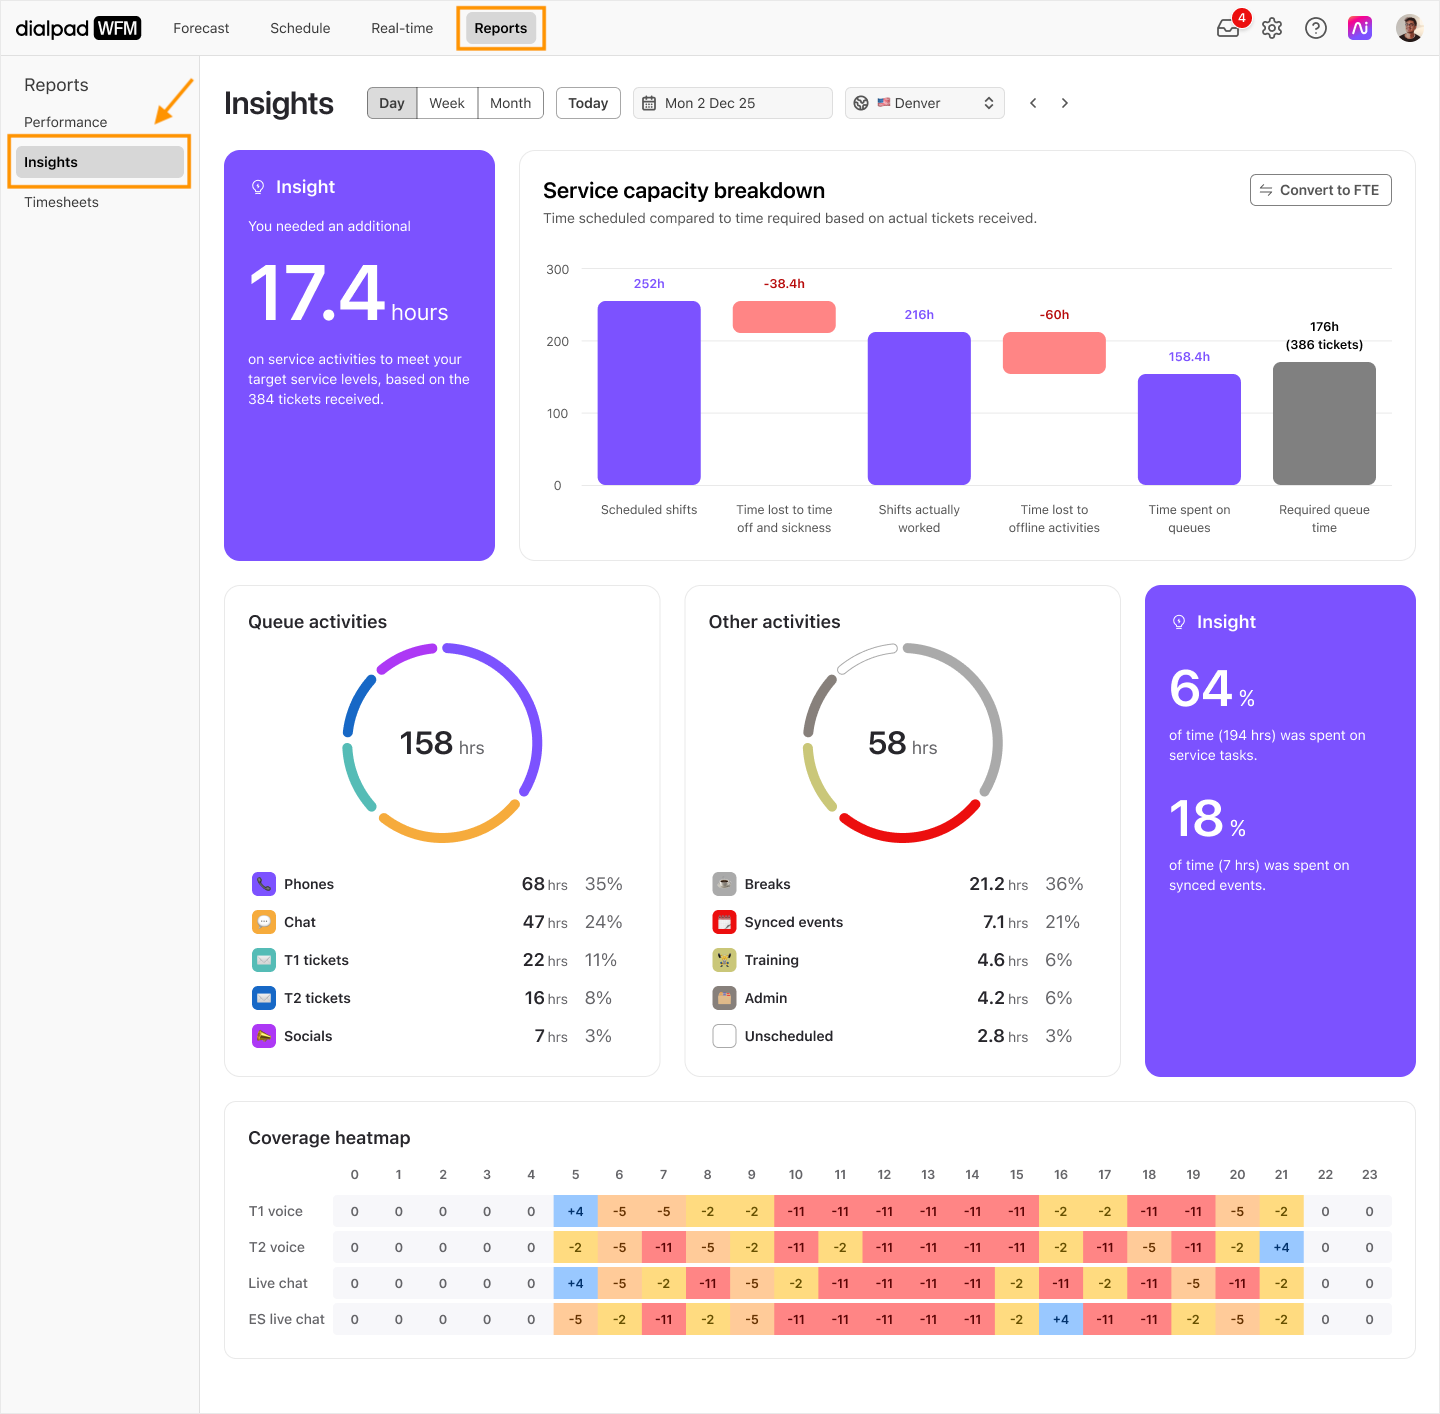
Here, you’ll find four widgets and customized insights designed to help you:
Assess scheduling effectiveness and pinpoint areas for improvement.
Monitor time-off levels.
Analyze team utilization.
Armed with this data, you can make data-driven decisions, optimize resource allocation, and ensure each channel and activity gets the attention it requires.
Note
For future dates, insights are calculated using forecasted ticket volumes.
For past dates, we use your actual ticket data.
Let’s look at each section.
Service capacity breakdown
The Service Capacity Breakdown offers a clear overview of capacity lost throughout the planning process, comparing your actual staffing levels to what’s required.
It visualizes external shrinkage (time lost to absences like sickness) and internal shrinkage (time used for non-service tasks, breaks, and meetings).
Additionally, Dialpad WFM highlights whether you are currently under or overstaffed, or if future schedules will result in staffing imbalances, helping you optimize workforce planning.

Understanding Service Capacity Breakdown
The Service Capacity Breakdown chart displays the following six bars, each showing time in hours, to highlight staffing levels, shrinkage, and capacity gaps.
Planned Shifts: Total hours originally scheduled, including shifts overridden by time off.
Time Off: Hours lost due to planned absences.
Scheduled Shifts: Total hours scheduled after accounting for time off.
Offline Time: Hours allocated to non-service tasks.
Queue Time: Hours assigned to service tasks linked to forecasts.
Required Queue Time: Hours needed to meet service targets, based on ticket volumes and average conversation time.
The insights card shows the difference between queue time and required queue time for better capacity planning.
This lets you:
Decide if time off can be approved.
Spot trends in staffing levels.
Understand how utilization impacts capacity.
Get accurate FTE capacity reports.
Tip
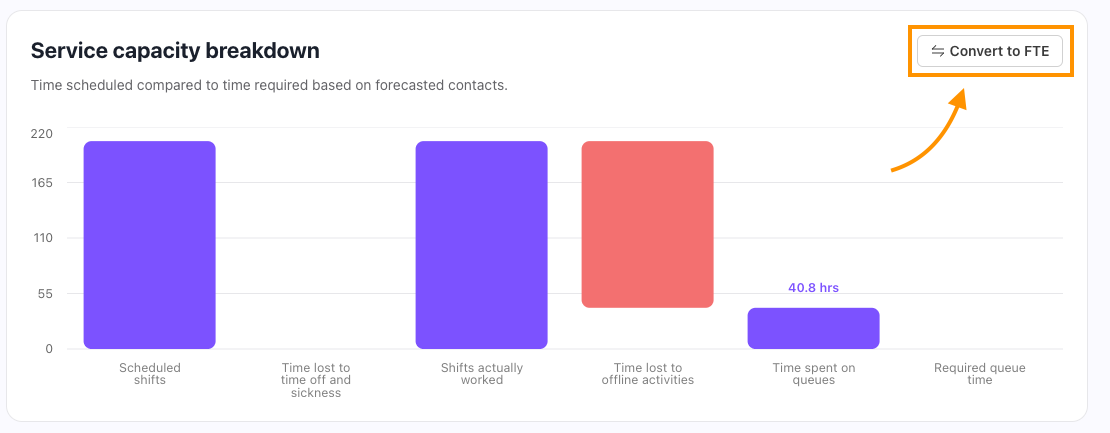
By default, the service capacity breakdown chart displays in hours. To view it in Full Time Equivalent (FTE), select Convert to FTE.
Activity time breakdown
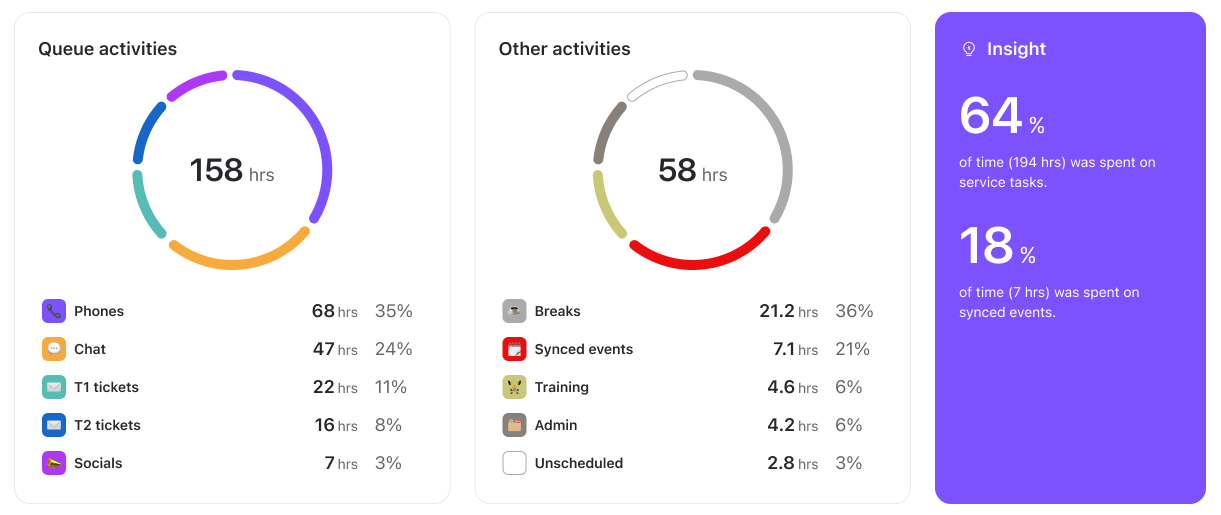
The Activity Time Breakdown shows how time was allocated across service and offline activities. It provides the total hours scheduled for each activity, along with its percentage of total time.
The insights card highlights the percentage of time spent on service tasks (utilization) and identifies the largest form of internal shrinkage, revealing the non-service activity that consumed the most time.

This lets you:
Make smarter decisions about resource allocation.
Plan activities and channels more effectively.
Ensure every task gets adequate focus.
Spot areas for scheduling improvement.
Maximize team utilization while minimizing downtime.
Coverage heat map
The Coverage Heat Map provides a summary of your team’s coverage for the selected period, helping you assess how well your team was scheduled across different activities and times of day.
The heat map highlights the gap between the number of agents scheduled and the number needed, allowing you to identify coverage discrepancies and improve future scheduling.
This lets you:
Identify areas of over or understaffing.
Update your shift plans by adjusting start or end times for more balanced coverage.
Adjust activity rules, such as extending lunch windows, to improve coverage.
Frequently asked questions
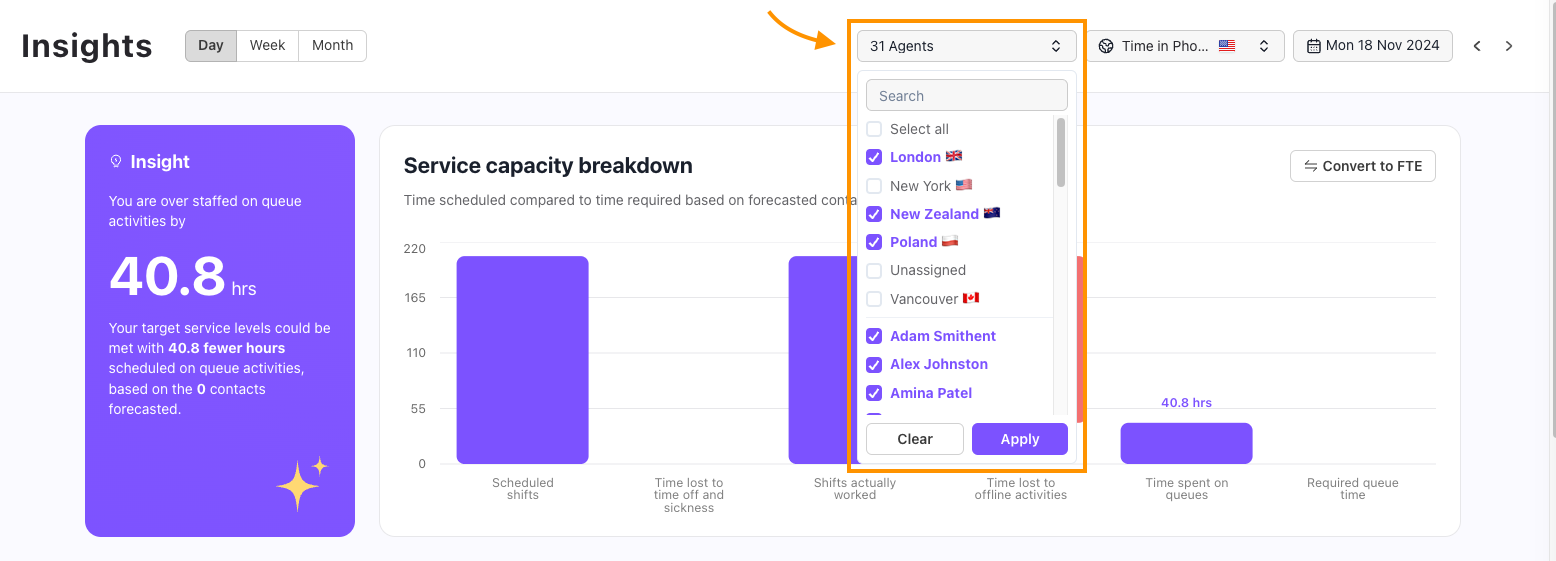
Can I view insights for specific teams?
Yes. Use the agent filter to select specific teams and/or agents. 
Can I export Insights data?
Not yet, but stay tuned as we’re continuously adding new functionality.
