Dialpad's Digital Customer Sessions Volume by Day report provides insight into how your digital customer demand and outcomes trend over time, grouped by the day the interaction occurred.
It breaks out daily volumes of digital sessions into three key categories, segmented by handling type, helping you quickly spot changes in automation effectiveness, live support load, and abandonment patterns across your digital channels.
Let's get into the details of this report.
Who can use this
The Digital Customer Sessions Volume by Day report is available for Dialpad users with the Dialpad BI add-on who are Company Admins or have Analytics-specific permissions.
You'll also need to be on a Dialpad Support or Dialpad Sell plan.
Default Filters
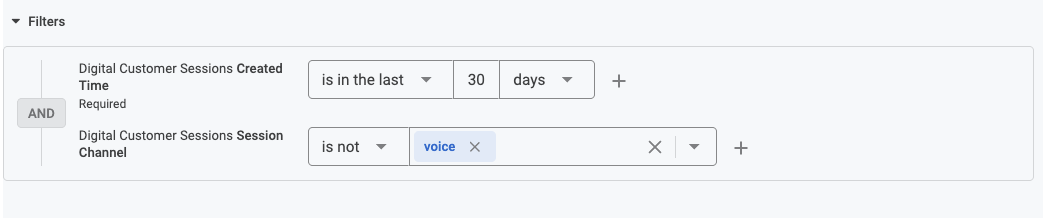
This report contains two default filters:
Digital Customer Sessions Created Time
Digital Customer Sessions Session Channel
Visualization Type
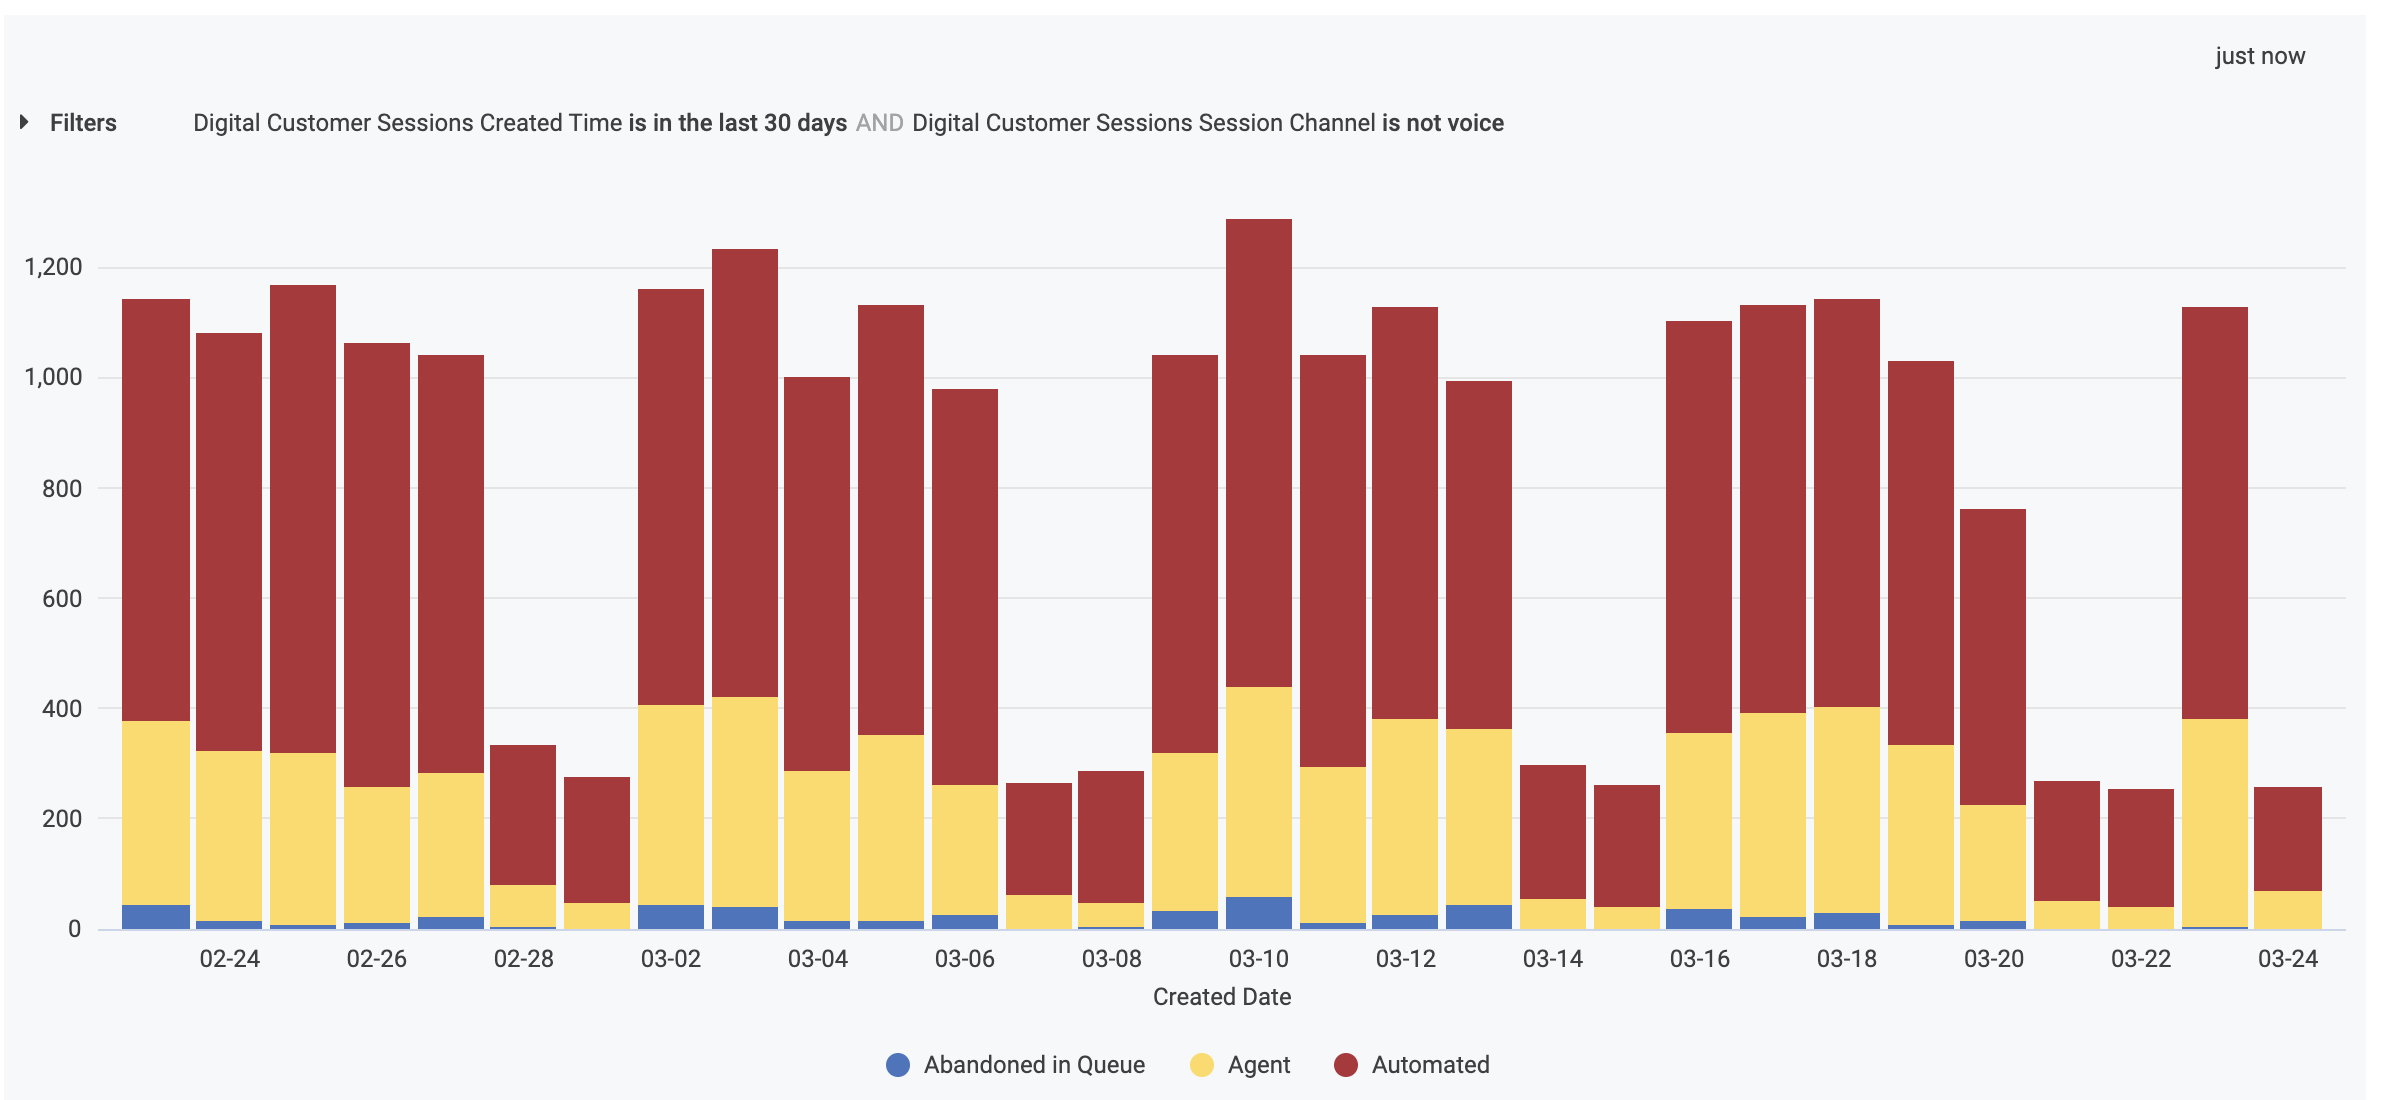
The Digital Customer Sessions Volume by Day report is a templated report displayed in a bar graph format.
Select Settings (the gear icon) > Download to save your data to your computer, with multiple formatting and selection options.
Data Dictionary
This report contains unique Analytics definitions — read through the following table to learn more about the data in your report.
Automated (Red) | Sessions successfully handled by the AI agent. |
Agent (Yellow) | Sessions that were handled by a human team member. This includes AI agent-to-human escalations. |
Abandoned in Queue (Blue) | Sessions where the customer disconnected while waiting for an agent to join the chat. A high count here may suggest long wait times. |
Created Date | The specific day the interaction occurred, allowing you to track resolution trends over time. |
Note
For more information on BI's datasets and notable concepts, be sure to review this Help Center article.