Leverage Dialpad’s Digital Analytics to gain actionable insights into your team's digital conversations. With data on agent activity, surveys, sessions, AI Agents, and more, you can make informed decisions to boost efficiency, performance, and customer satisfaction.
Let’s dive into the details.
Who can use this
Dialpad’s Digital Analytics is available to users with a Digital Contact Center.
To see Ai Agent data, you’ll need to be using Ai Assistant or have an Ai Agent.
Access digital session analytics
To access your team’s digital session analytics, head to the Dialpad Admin Portal.
Select Analytics
Select All digital
(1)(2).png)
Filter the data
Dialpad offers these filters, letting you tailor your view to display exactly what you need.
Contact Center Filter: Displays interactions based on the selected Digital Contact Center(s).
Date Filter: Displays interactions based on the selected date range.
Channels Filter: Displays data based on the selected digital channel(s).
AI Agents Filter: Displays data by the selected AI Agent(s).
Session Direction Filter: Displays data based on session direction(s).
Duration Filter: Displays data for interactions of a specific duration.
Expertise Filter: Displays data based on the selected agent’s expertise group.

To apply a filter, select the filter, then choose your criteria.
Once you’ve applied a filter, you can choose to save it for later, or clear it. 
Note
When you navigate between different tabs, you’ll notice that filters might become greyed out. That’s because not all data applies to every filter.
For example, if you’re looking at AI Agent data, you won’t be able to apply the ‘Session Direction’ filter, as there is only one possible direction.
The All digital view contains three tabs:
Sessions: Displays key metrics on your digital interactions.
This includes queue size, automation, session capacity, and more.
Surveys: Displays key CSAT survey metrics.
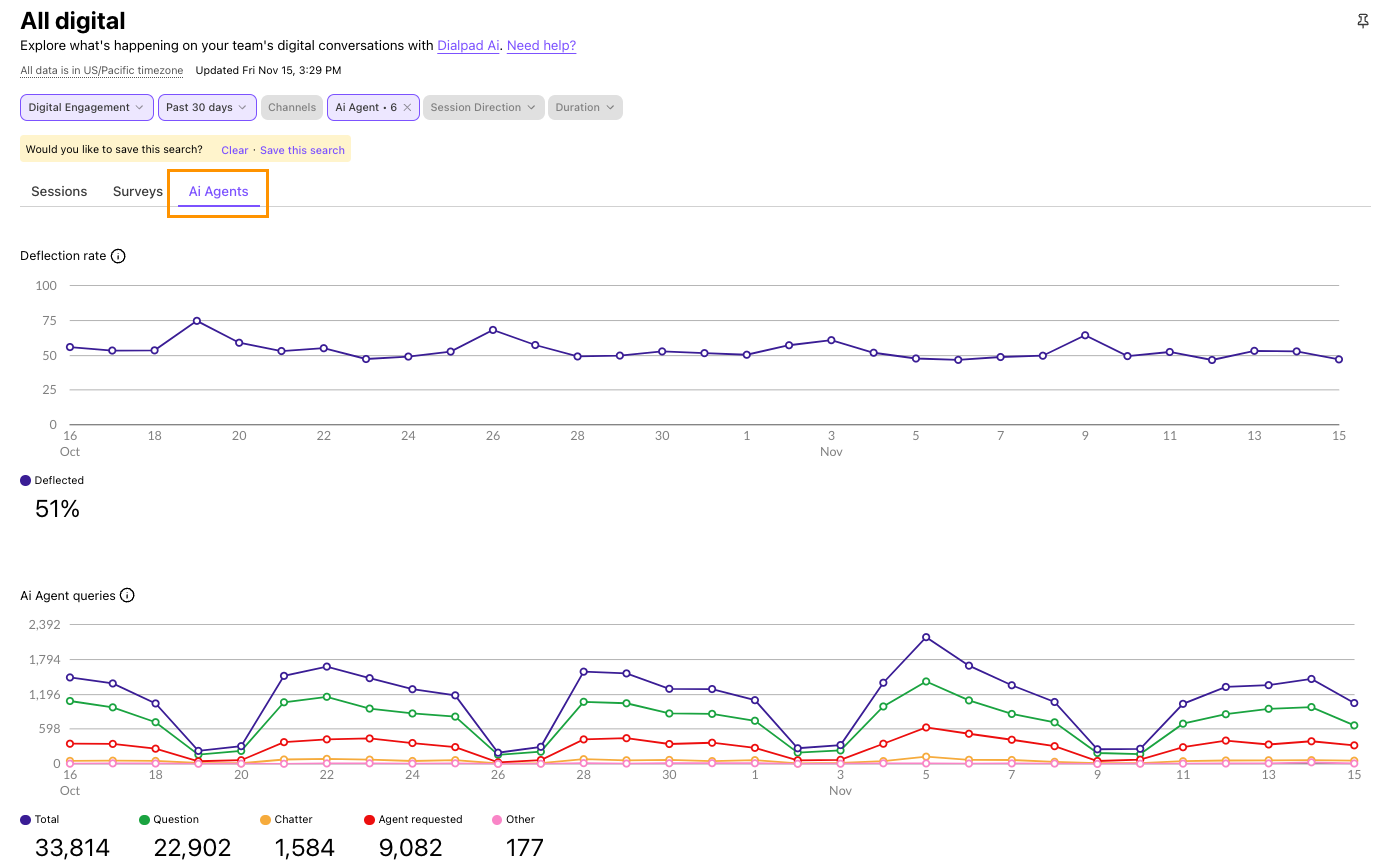
AI Agents: Displays key AI Agent metrics.
Let’s look at each tab.
Session analytics
These are types of sessions:
Automated Session: An interaction where the user is guided by automated responses or workflows without agent involvement.
This is the default session type.
Queued Session: The time a user spends in a queue waiting to connect to an agent.
Queued Sessions end when the user disconnects or when the wait exceeds the max wait time (queued time out).
Agent Session: Sessions with a connected agent.
Agent Sessions can end as "abandoned" if the user leaves before the agent responds, or as "agent handled" if the agent sends a message.
Inbound Session: Digital interactions where users engage with agents or automated systems through digital channels.
These sessions include queued sessions, where users wait to connect to an agent, and agent sessions, where the interaction involves a connected agent. Automated sessions are also part of inbound sessions, where users are guided by automated responses without agent involvement
The Sessions tab provides insights into your digital sessions.
From the All digital view, set your filters, then select Sessions. .png)
Here, you’ll see the following six graphs:
Available session capacity: Displays the number of open sessions available across all agents.
The large number at the bottom displays the peak session slots available.
Deflection rate: Displays the total percentage of sessions that were automated and never connected to an agent.
Sessions: This displays an overview of your sessions. You’ll see the total number of sessions and the totals for each type of session.
Agent sessions by channel: Displays the number of agent sessions on each of the selected channels.
The large numbers at the bottom display the totals for each channel type.
Automation sessions by channel: Displays the total automation per channel.
The large numbers at the bottom display the totals for each channel type.
Peak queue size: Displays the number of sessions in the queue at a specific time.
The large number at the bottom displays the highest queue size.
Tip
Hover over any day to see the breakdown.
Survey analytics
Keep a close eye on customer satisfaction by tracking your survey engagement and results.
To see your survey analytics, head to the Surveys tab in the All digital view.
Here, you’ll see the following two graphs:
Survey engagement: Displays how many users have (or haven’t!) completed your surveys.
Survey CSAT: Displays the average CSAT survey score over the selected time range.
Hover over a day to see its detailed breakdown.
.png)
Ai Agent analytics
Check AI Agent performance to ensure your AI Agents are responding accurately, resolving customer issues quickly, and keeping users engaged.
To see your AI Agent’s analytics, head to the AI Agents tab in the All digital view. 
Here, you’ll see the following graphs:
Deflection rate: Displays the total percentage of AI Agent sessions that never connected to an agent.
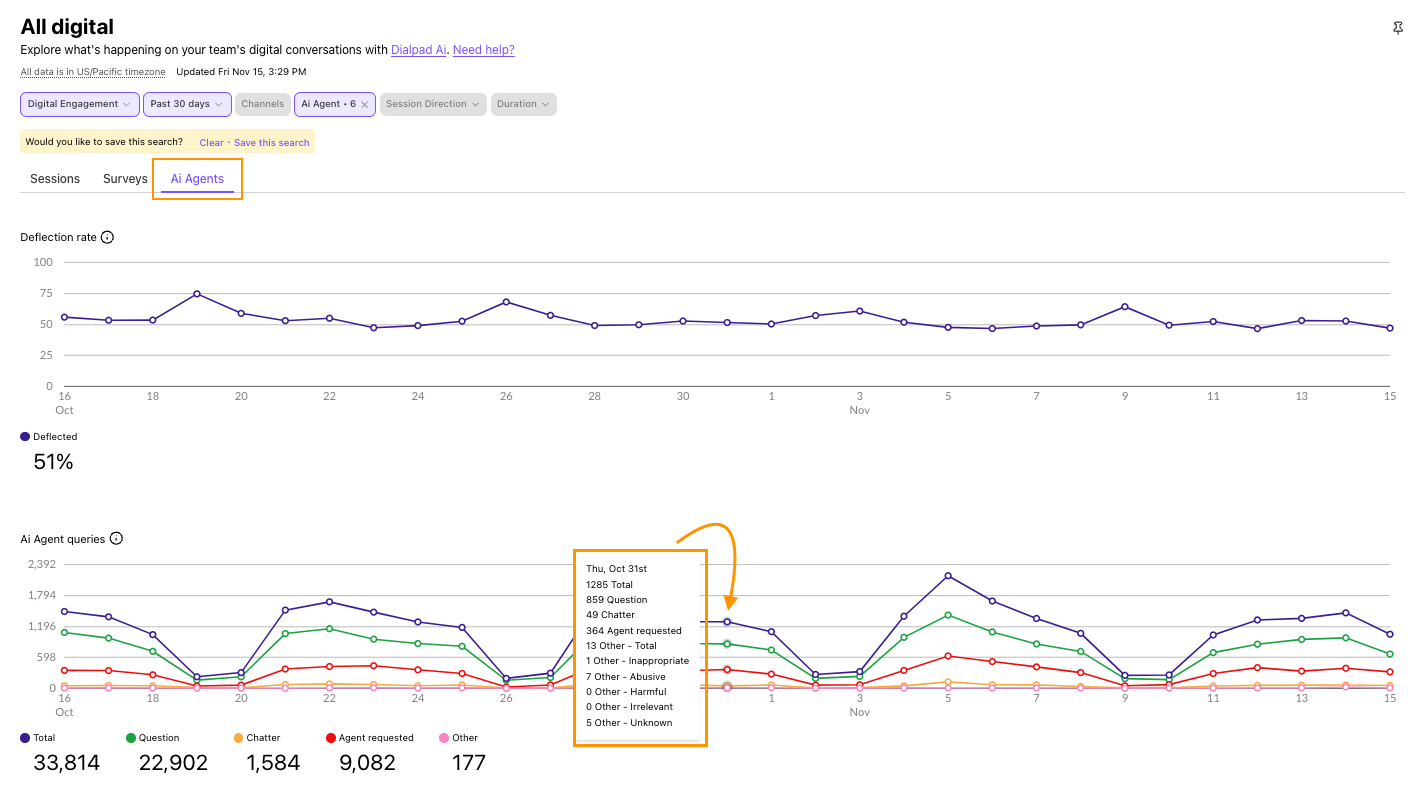
Questions: Displays a breakdown of all question types asked to your AI Agent.
Dig into user intent by looking at the ‘Other’ category.
Answers: Displays how many questions were answered (or unanswered) by your AI Agent.
The numbers at the bottom display the totals for each classification.
Answer feedback: Displays the number of thumbs-up and thumbs-down feedback given to your AI Agent’s answers.
The numbers at the bottom display the totals for each feedback type.
Hover over a day to see its detailed breakdown.

Live session dashboard
Dialpad’s live session dashboard provides real-time insights into customer interactions across digital channels. With customizable filters and saved searches, you can easily track your Digital Contact Center’s key metrics and identify areas for improvement.
To access your digital dashboard, head to the Dialpad Admin Portal.
Select Live Dashboard
Filter for the desired Contact Center(s), time period and channel(s)
The default time period is 4 hours.
Select Digital
(1).png)
Here, you’ll see the following graphs:
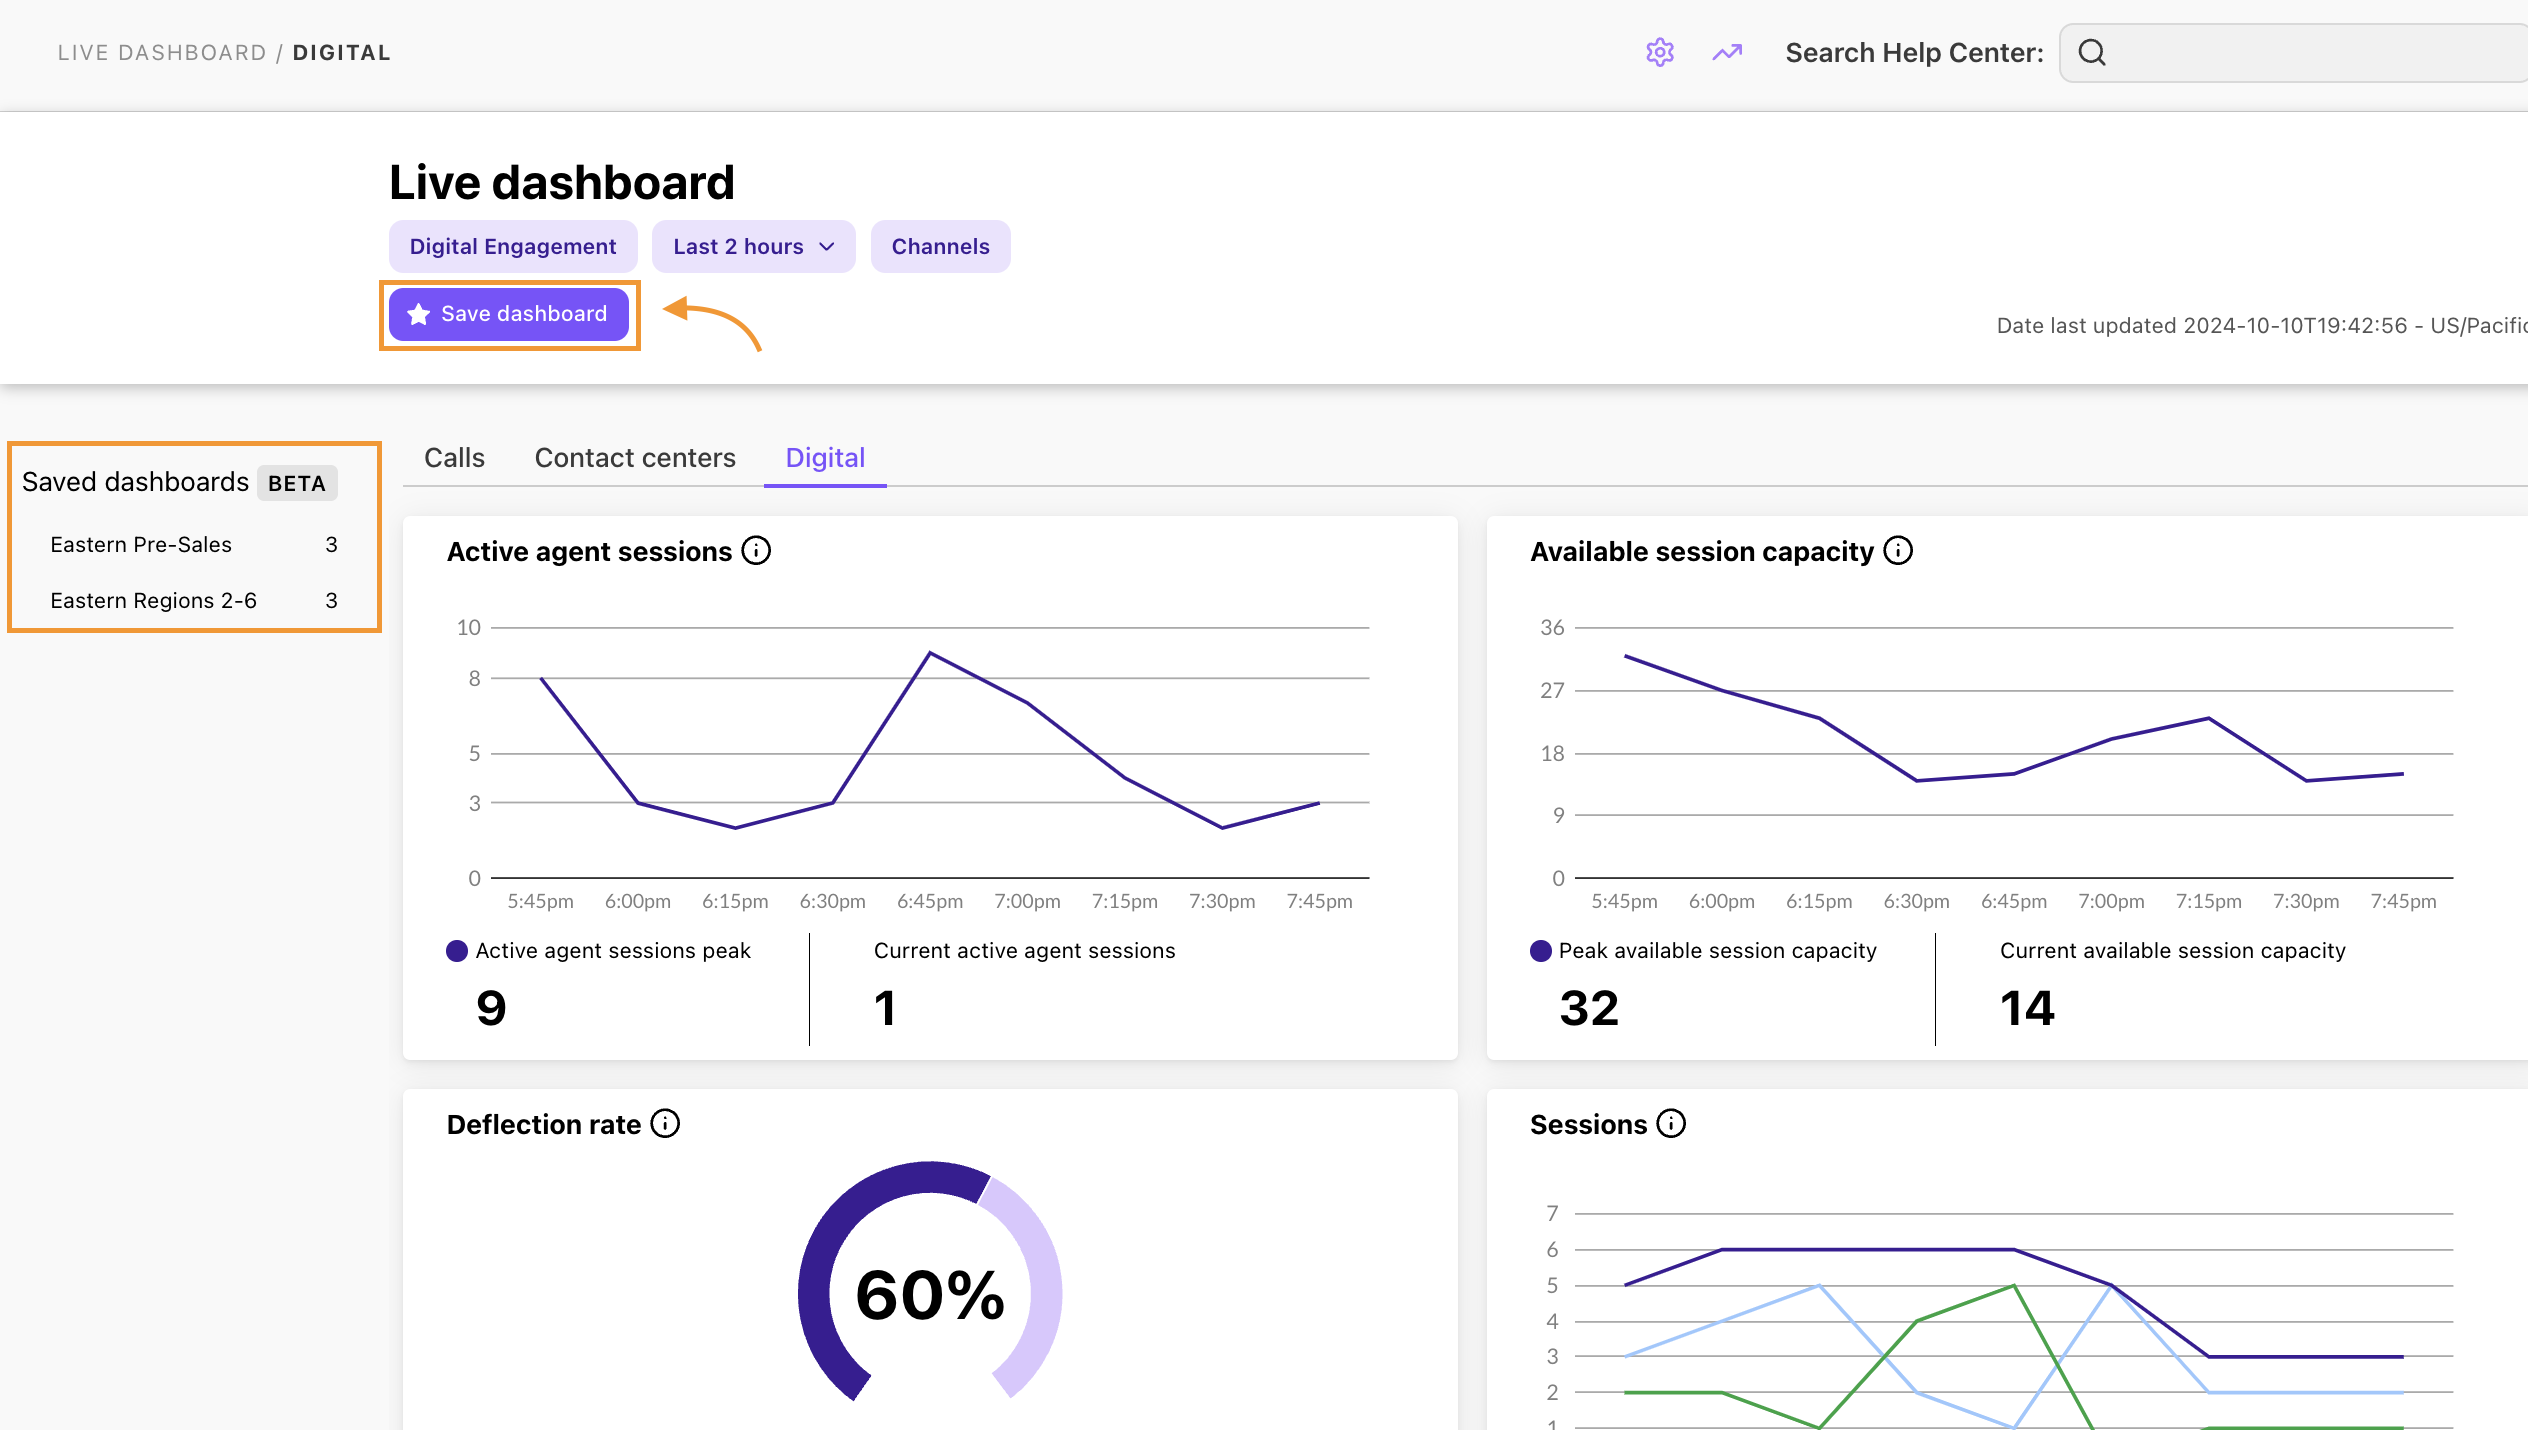
Active agent sessions: Displays the number of active agent interactions across the selected channels and time frame, displayed in 15-minute intervals.
At the bottom of the graph, you’ll see the peak interaction volume and the current number of active agent sessions.
Maximum session capacity: Displays the maximum number of available sessions across the selected channels and time frame, displayed in 15-minute intervals.
At the bottom of the graph, you’ll see the peak available sessions capacity and the current available session capacity.
Deflection rate: Displays the percentage of AI Agent sessions that never connected to an agent.
At the bottom of the graph, you’ll see the total number of sessions and the number of automated sessions.
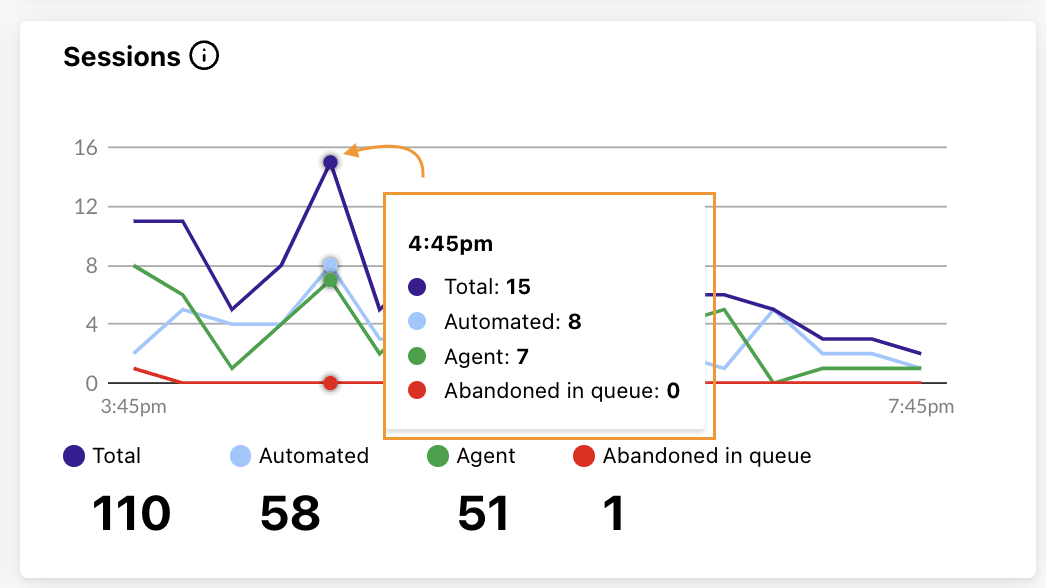
Sessions: Displays an overview of your sessions.
At the bottom of the graph, you’ll see the total session count and totals for each type of session.
Agent sessions by channel: Displays the number of sessions that required an agent.
At the bottom of the graph, you’ll see the totals for each channel type.
Automation sessions by channel: Displays the total automation per channel.
At the bottom of the graph, you’ll see the totals for each channel type.
Survey engagement: Displays the outcome of your surveys.
At the bottom of the graph, you’ll see the totals for survey completion types, as well as what percentage of surveys were completed.
Survey CSAT: Displays the average CSAT survey score over the selected time range.
At the bottom of the graph, you’ll see how many surveys were valid, and what the average score was.
Active queued: Displays how many customers were waiting in your queues in 15-minute intervals.
At the bottom of the graph, you’ll see the estimated wait time, the highest queue volume and how many people are currently queued.
AI Agent queries: Displays a breakdown of all question types asked to your AI Agent.
At the bottom of the graph, you’ll see the total number of queries asked, as well as question, chatter, and agent requested totals.
Dig into user intent by looking at the ‘Other’ category.
AI Agent answers: Displays how many questions were answered (or unanswered) by your AI Agent.
At the bottom of the graph, you’ll see the totals for each classification.
Total answers are equal to all queries categorized as questions.
Tip
Hover over any time period to see its detailed breakdown.
Frequently asked questions
Can I save a dashboard?
Absolutely! Once you’ve applied your filters, select Save dashboard so you can come back to this view at any time.
Once saved, your dashboard will appear in the Saved dashboards section of your Live Dashboard. 
Can I export digital sessions data?
Yes, however, you’ll need to contact your Customer Success Manager to have this functionality enabled.
To export your digital sessions data:
Apply your filter(s)
Select Export(.csv)
Choose which data you want to export
Export raw data for all charts - Exports the granular raw data from each chart on the dashboard
Export custom selection - Exports the data from the selected charts
Select Send report
.png)
Why doesn’t the timezone match?
Digital session analytics are based on your Office’s timezone. If your timezone is different than your office, it will seem off.
Why doesn’t the data match the old dashboard?
Due to the updated definitions, you may notice a slight difference from the old dashboard. That said, differences should be minuscule, if you’re seeing a dramatic change, please reach out to our support team.

