Dialpad Meeting's built-in analytics dashboard gives users and teams insights into meeting trends. Easily see which days of the week are busiest for meetings, how long your meetings lasted, how many participants were in your meetings, and much more!
Let's dive into the details.
Who can use this
You'll need a Dialpad Meetings Business license to access user analytics.
Individual users can access their own analytics.
Dialpad Meetings and Dialpad Admins can access their analytics, and analytics for their entire team.
Analytics menu overview
Your analytics overview includes a breakdown of total conferences, total minutes, total participants, unique participants, and average minutes per call.
You can access the analytics overview from the Dialpad Meetings dashboard:
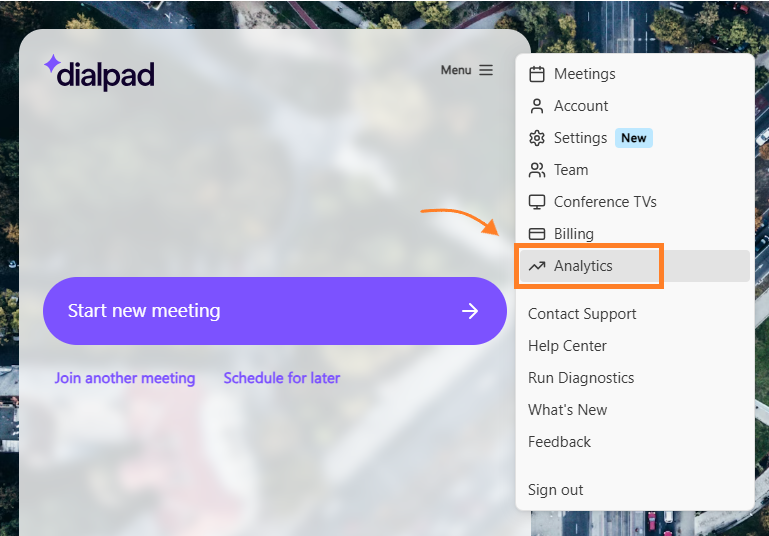
Select Menu
Select Analytics
Choose your desired date range
Past 7 days
Past 30 days
Past 90 days
Select the desired tab
Total Meetings: Displays information on meeting duration, participant numbers. and daily trends.
Meeting Duration: Displays information on how long each meeting lasted, and your total meeting time.
Screenshares: Displays the number of meetings and screenshares per day.
.png)
The Habits section details your busiest day and information on where your participants were joining from.
Meeting metrics
In the analytics overview, you'll see the following metrics:
Total meetings: Total number of meetings during the selected time frame.
Total minutes: Total number of minutes spent in meetings during the selected time frame.
Total number of participants: Total number of participants in your meetings during the selected time frame.
Total number of unique participants: Total number of participants in your meetings during the selected time frame.
Average duration: Average meeting length during the selected time frame.
Screenshares: The number of meetings where one participant shared their screen.
Each broadcast counts as one screenshare. If two people share their screen during the same meeting, that will count as two screenshares.
Frequently asked questions
Why don't I see the Analytics menu?
User analytics are not available on free accounts. Upgrade your plan to take advantage of detailed user and team analytics.