Data means nothing if you can't interpret it!
We want to provide you with key information and context, but the details of your specific network configuration will have a significant impact on how to apply the suggestions. Please work with your IT team to identify possible mitigation strategies and solutions for addressing these results.
Our test provider makes a lot of in-depth articles available to help provide context and troubleshooting for your results in their resources pages: Visualware Quality Test Resources. The following is a summary of highlights of how to interpret the results and will cover some of the points mentioned in that article.
Note about the MOS score metric
The Mean Opinion Score (MOS) is a metric for determining subjective sound quality in VoIP calls and simplifies talking about call quality in some respects. The MOS value is normally between 1 and 5, with 5 being the best possible score. A score of 4.0 or better is typically a sign of good overall quality.
Interpreting the basic test results
The results for the Basic Test are grouped into the following tabs.
| Speed shows results related to achieved download and upload speeds, consistency, timing, and delays. It also shows your test URL for getting detailed information about the speed test results. |
| Capacity shows a count of packet losses (if any) at various speeds to help identify signs of LAN and internet capacity problems. |
| Route shows a table of results for the traceroute tests, giving a sense of the quality of the path between your device and Dialpad’s test servers. |
| VoIP shows the jitter and packet loss rates tracked during the test. Click the link on this for an alternate and more detailed view of the same data. |
| Firewall lists the count of Open ports vs Blocked ports from the basic test. For detailed ports checking, review the results for the Full Ports Test. |
| Graph shows a series of six reports showing various metrics in relation to time and, where relevant, to other metrics. There is also a link for reviewing a detailed analysis at the bottom of these results. |
| RTT shows the real results and the average for how long it took packets to get from your device to the testing server and back. |
| Summary shows a high-level view of the test results and includes many links describing definitions, test parameters, and more details for each test. |

When the test is complete, it defaults to the Summary view, which was initially covered in the Basic Test Results article.
Our References and Additional Resources page links to sites where additional details can be found for helping learn about these results and improve network performance.
Speed
As mentioned in Terms Used in this Article, speed is the subjective evaluation of the effects of bandwidth and latency, ie: How fast a connection feels. A fast network experiencing long delays in travel times (latency) might feel slow, even if the bandwidth available is very high.
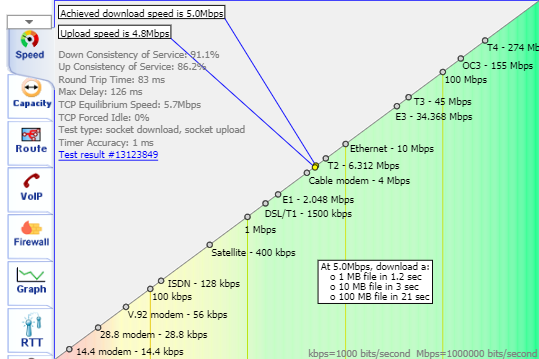
The speed test provides a visual representation of how your measured download and upload speeds relate to many different speed milestones.
You'll also see a chart listing the following metrics:
Down and Up consistency of service (CoS): The percentage result of how often your actual transmission speed met your service maximum speed. Being able to get 100 Mbps is nice unless it’s only for a millisecond and then you’re getting old dial-up speeds the rest of the time. It’s better to have lower bitrates and higher CoS than a high bitrate and a low CoS.
Round Trip Time (RTT): The count in milliseconds of how long it takes for a single packet to get from your device to the testing server and back again.
Max Delay: The longest wait measured during the RTT test.
TCP Equilibrium Speed: How much traffic passed between the client and server before the rate packets were being sent by the client and received by the server were in sync. (ie: Keeping buffer queues as low as possible.)
TCP Force Idle: Similar to how a road that is lightly used has capacity available, TCP Forced idle is the size of the gap between what could be transmitted over the route versus what was actually transmitted. This gap increases when a connection is being throttled, meaning packets are being queued instead of being transmitted, leading to choppy audio.
Timer Accuracy: Not discussed in these results.
Let's go over what the metrics for each of the above categories, and learn how to manage performance issues.
CoS: If you’ve got a CoS score far from 100%, then you’re not transmitting everything possible during the network tests. This metric alone is not likely enough to suggest what kind of problem may be present.
If the CoS score pulls your bandwidth to a mere trickle of what you’re paying for with your ISP, that is likely worthy of an additional investigation into network constraints and ISP service quality.
RTT: Dialpad works hard to ensure there are regional clusters serving people around the world. This helps improve call quality by keeping call management local. Good values for most US customers are going to be in the 40ms or lower range. Delays much higher than this start to lead to pronounced delays in-call audio, making it seem like the other person is taking a long time to respond.
High RTT can be caused by inefficient routes through the internet, between your ISP and the Dialpad test servers. The ISP may need to be notified of this to fix peering routes.
VPNs are likely to add RTT and force data to be cut and sent into bigger chunks, which severely degrades real-time calls. The industry standard Best Practice is that VPNs are not supported for VoIP traffic, and so configuring a split-tunnel will be necessary to protect the integrity of VoIP communications. Dialpad has multiple measures in place to protect data security without sacrificing performance.
Max Delay: Not a strong metric on its own because it only reports the largest RTT and doesn’t describe the typical RTT. Some servers don’t respond and that is reported automatically as a 100ms delay.
TCP Force Idle: The max delay recommended for VoIP is 40ms, because longer delays will trigger retransmitting of packets already sent because they are assumed to have never arrived. That duplicates traffic through the network and can lead to choppy audio and missed calls, and in tightly constrained networks this could worsen an existing congestion problem.
Security appliances, routers behaving poorly, and ISPs throttling local connections to their network could all trigger extremely long TCP pauses.
It’s also possible that the speed test will reveal the saturation of the local LAN link. That means that too much of the available bandwidth is being used, which requires dealing with the bottlenecks through network reconfigurations, restrictions on tools like backup sync systems, and streaming media devices and apps. Purchasing more bandwidth from a provider may be available in your area and could alleviate traffic pressure so long as the local network is configured to handle the increased traffic flow.
Our References and Additional Resources page links additional sites if you'd like to learn more about these results and how to improve network performance.
Capacity
As mentioned in Terms Used in this Article, network capacity is the evaluation of network performance between two endpoints. Capacity takes into account bandwidth, latency, and changes in network behaviors over time. It is a stress test of the network (up to 80 Mbps) and can reveal weaknesses in LAN connectivity that would affect VoIP traffic.
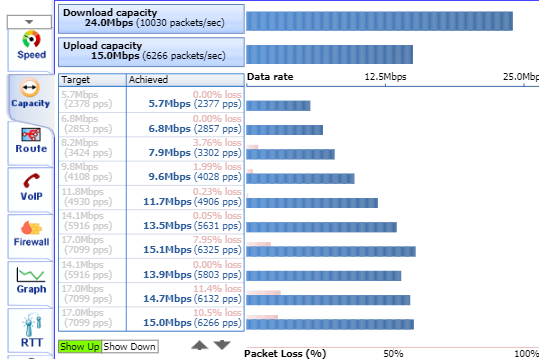
The results page shows the various target speeds, the actual speed achieved at that bandwidth, and the packet loss for each rate.
Use the Show Up/Show Down ( ) options to choose which traffic direction results to look at. It’s common that downlink behaviors will be different from uplink behaviors, especially in highly asymmetrical broadband connections.
Use the up and down arrows (.png) ) to view the pages of results showing bitrates and packet loss.
) to view the pages of results showing bitrates and packet loss.
Capacity results
Packet losses at high rates are common, and so long as rates are at 1% or lower, things should generally work okay.
The priority concern should be packet losses noted at lower bitrates, which is where the speeds at which VoIP calls and video conferencing function, as this is where all kinds of poor behaviors happen, including unexpected disconnects, call quality issues, difficulty answering calls, and errors about connectivity from the app and the device’s operating system.
Packet Loss: If individual users are having issues, packet loss might be improved by replacing an older Ethernet cable between the phone or computer and the wall with a newer CAT5e or CAT6 cable.
Packet Loss for multiple users in the same network: This tends to suggest a problem with one or more ports on the switch, and possibly outdated firmware on network devices. If the LAN is shown to be operating within good parameters, then the ISP should be contacted for support in tracking down the source of missing packets.
Packet Loss by VPN users: VPNs are extremely prone to mangling real-time data into chunks that make it useless, which severely degrades real-time calls, even if it sometimes seems to work well enough. The industry standard is that VPNs are not supported, and Dialpad advises that all call traffic be routed out of the VPN via a split-tunnel configuration. We have multiple industry best practices in place to protect call security without sacrificing performance.
Our References and Additional Resources page links to sites where additional details can be found for helping learn about these results and improve network performance.
Route
As mentioned in Terms Used in this Article, a route is a path from one endpoint through each network device along the path to the destination endpoint. Our tool runs this test twice, once from your device to the server (outgoing route) and once from the server to your device (incoming route). Be sure to click the page buttons ( ) to see all the hops in the route, and the Show server to client | Show client to server buttons to check both directions.
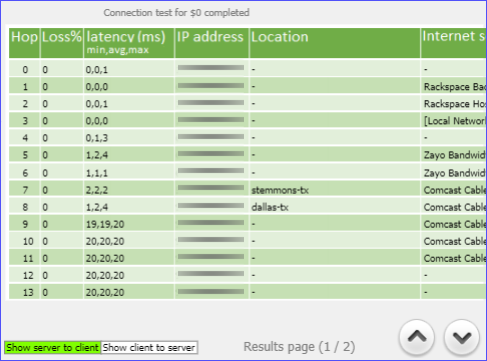
On the inbound test, the last hop is your device. On the outbound test, the last hop is our testing server. You can generally ignore hops with the same first two sets of numbers in the address.
Note about cloud services
When you see a cluster of IP addresses with very similar digits in the first and second positions in an IPv4 address (111.222.###.###), those are often either ISP backbone connections or cloud systems. Any reports of 100% loss on these typically mean only that those machines were prioritizing real data and ignoring test packets. If you run the test again, you might find that some or all of the backbone or cloud machine IPs have changed because different servers were involved in the traffic route. Feel free to ignore these servers and skip to the last hop.
Let's go over what this means.
Packet loss on the first two hops, or on the last hop: These suggest a potentially serious problem with packet loss within your network or between your network and the ISP. Please alert the IT team and they can investigate.
Imbalanced hop count: If both routes (in and out) have roughly the same amount of hops, then things are probably fine as far as the routes go. If one route is 19 hops and the other is 11, please alert the IT team and they will probably need to work with the ISP to resolve the peering problem.
Infinite hops, 1000 hops: Whenever there are more than around 20 hops, there may be a problem. More than 25ish hops could be a sign of a serious problem. VPNs will often drop ping test results and that will show as failures with 100% loss. Try again with the VPN disabled and see if the routes are in balance. See also the previous note about cloud services.
Our References and Additional Resources page links to sites where additional details can be found for helping learn about these results and improve network performance.
VoIP
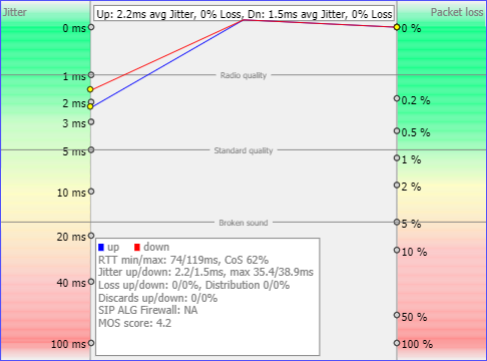
As mentioned in Terms Used in this Article, jitter is a key metric in predicting VoIP quality. This report focuses on packet loss and jitter as key factors in assessing VoIP readiness. The test runs a simulation of 10 concurrent VoIP (G.711 audio codec) calls and calculates jitter, packet loss, and MOS scores.
If jitter is high, that means that data is sometimes taking too long to get from one place to another and sometimes coming in very fast. The inconsistency leads the system to start resending data to reduce the chances of missing audio, which adds more load on the network.
We recommend that jitter be kept at 5ms or lower because of the time-sensitive nature of real-time traffic.
Jitter can be momentary (a blip), ongoing (a persistent gradual delay that may increase with time), or choppy (lots of jitter in a short period of time).
Let's go over what this means.
VoIP Jitter exceeds 5ms: Report the issue to the IT team for investigation. This behavior can contribute to dropped calls and muffled audio. Improvements can be made by updating the packet prioritization via QoS rules, by adjusting WiFi settings or proximity to the nearest WiFi access point, and by making sure file sync tools aren’t clogging the network as they’re making updates. Where possible, isolating VoIP traffic over its own top-priority VLAN can remove a lot of sources of interference from other network traffic.
VoIP Jitter reports shows packet loss (regardless of jitter pattern): This is a connectivity problem. Work with the IT team to check for WiFi signal loss, loose or damaged cables, switch logs for errors, and possibly the Internet service to the office to ensure minimal interference. Network infrastructure devices and cabling that are very old or poorly maintained (covered in dust, paint, etc.) can also contribute to data getting lost on its way through the network.
VoIP summary reports that SIP ALG Firewall is active: SIP ALG is a firewall technology that is potentially very harmful to VoIP traffic. The feature is often enabled by default by ISP-provided routers and modems. Please disable this option and see if call quality has improved.
Our References and Additional Resources page links to sites where additional details can be found for helping learn about these results and improve network performance.
Firewall
As mentioned in Terms Used in this Article, a firewall is a protective tool for networks and devices. It’s possible for rules on the network to be different from firewall settings on individual devices using the network. Firewalls work by going through a list of rules and Allowing or Blocking traffic based on those rules.
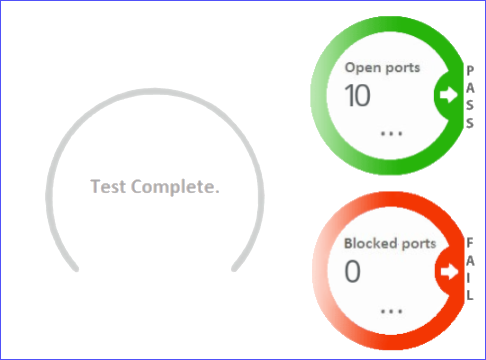
The firewall results in the Basic Test are a simple summary of the count of ports that are open or blocked, and it only tests a few essential ports and does a sampling of media ports used for VoIP calls. If any ports are blocked in this basics test, it is likely a cause for concern. Be sure to complete the Full Ports Test to find out which ports are being blocked.
The firewall results from the Full Ports Test are comprehensive: every port related to call controls and VoIP traffic is individually tested. Check the results of this test to get the list of exactly what ports are blocked.
The list of ports used by Dialpad is in our Network Recommendations article. Compare the results from the Full Ports Test to get a detailed list of which ports and protocols are blocked.
Let's go over what this means.
Only a few blocked ports: If the Basic Test showed no blocked ports and the Full Ports Test shows just a few, it’s generally fine to ignore those blocked ports. The chances are low that they’re the source of any issues you’re investigating. If we attempt to connect via a blocked port, we’ll retry on another one, and with just a few blocked, the likelihood that anyone will be negatively impacted is minimal.
More than a few ports blocked: As more ports are blocked, the chances of hitting a blocked port and then trying another port only to find it blocked are greatly increased. This will lead to sluggish responses from the system, including long delays in getting audio in your calls. Refer to the Network Recommendations article for a list of which ports need to be set to Allow for Dialpad VoIP communication.
Our References and Additional Resources page links to sites where additional details can be found for helping learn about these results and improve network performance.
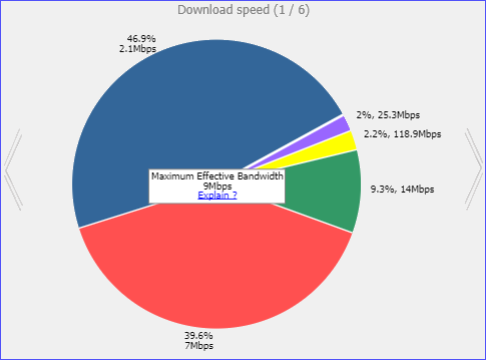
Graph
As mentioned in Terms Used in this Article, speed is the subjective evaluation of the effects of bandwidth and latency, ie: How fast a connection feels. The test measures packet loss and latency at different speeds, and then ranks them based on which speeds were most effective.
The Graph results tab shows six sets of results. Pages one and two highlight the maximum effective bandwidth of download and upload speeds.
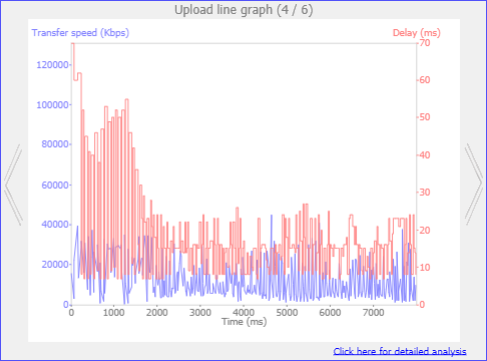
Pages three and four of the results show a timeline of speeds (blue) and delays (red) for up and down traffic. These two pages also include links in the bottom-right where details and more analysis can be reviewed.
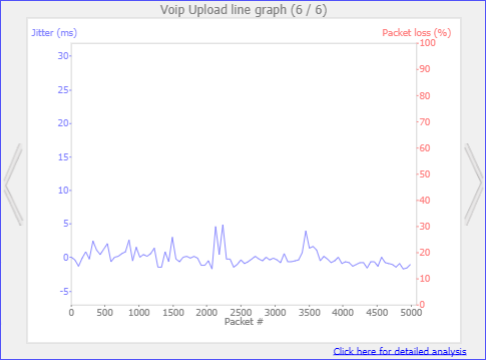
Pages five and six show jitter (blue) and packet loss (red) for several seconds of the test. Jitter ought to be 5ms or less. If test results show jitter above 10ms, especially if it happened often in the test, then you’re having poor connectivity. These results also include more detailed information by clicking the link in the bottom-right of either page.
When looking at the test results, be sure to compare the download and upload results to look for moments where the same kinds of problems occurred: packet loss, delays in transfer, spikes in jitter, and extreme behaviors.
Let's look at what this means.
Download/Upload Line Graph shows Delay (red) exceeding 40ms: A network device or the ISP may be handling too much traffic at once and is sending packets to force your device to stop sending data for brief intervals. This is normal behavior, to a point, but for real-time systems like VoIP, too much delay triggers audio cut-outs and robotic audio.
Regular patterns in jitter: Sometimes we can see a pattern in the jitter, such as a spike in jitter every two seconds. This is often caused by file tools like automated backup systems. Please alert your IT team if you see strong jitter patterns in your test results.
Our References and Additional Resources page links to sites where additional details can be found for helping learn about these results and improve network performance.
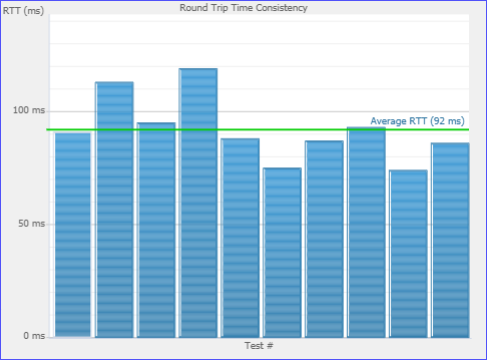
RTT
As mentioned in Terms Used in this Article, routes are the paths between clients and other systems on a network or the Internet, and testing the round trip time (RTT) over several intervals is useful for finding how efficiently routes between your device and the meeting servers are running. The ideal condition is that the speed over multiple tests is relatively the same, leaving only a minor deviation from the mean.
Let's take a look at what this means.
High RTT: Round trip time should be consistent between devices and networks in one geographic region and another geographic region. In the US and along the US-Canadian and US-Mexico borders, RTT to the nearest Dialpad servers should generally be 50ms or lower.
Fluctuating RTT + High Route time: When there is a lot of variance in the RTT and the routes in and out are very different from each other, then one of the ISPs involved is using a bad route. That means they’re not sending information over the most efficient route, and that will require assistance from your ISP to resolve.
Need More Help?
Interpreting the results can be a challenge even for experienced support people, so if you've got questions about your results or want help addressing something you found, please file a test results ticket and we'll follow up with you.
Want more technical details?
Our References and Additional Resources page links to sites where additional details can be found for helping learn about these results and improve network performance.