Dialpad WFM’s insights report provides insight into how effectively you have scheduled and managed your team’s time. Admins can use this report to better understand their shrinkage, utilization and coverage.
Let’s dive into the details.
Who can use this
Dialpad WFM is available to all Dialpad users and as a standalone product.
Contact your Customer Success Manager to discuss adding Dialpad WFM to your plan.
Access Insights Reports
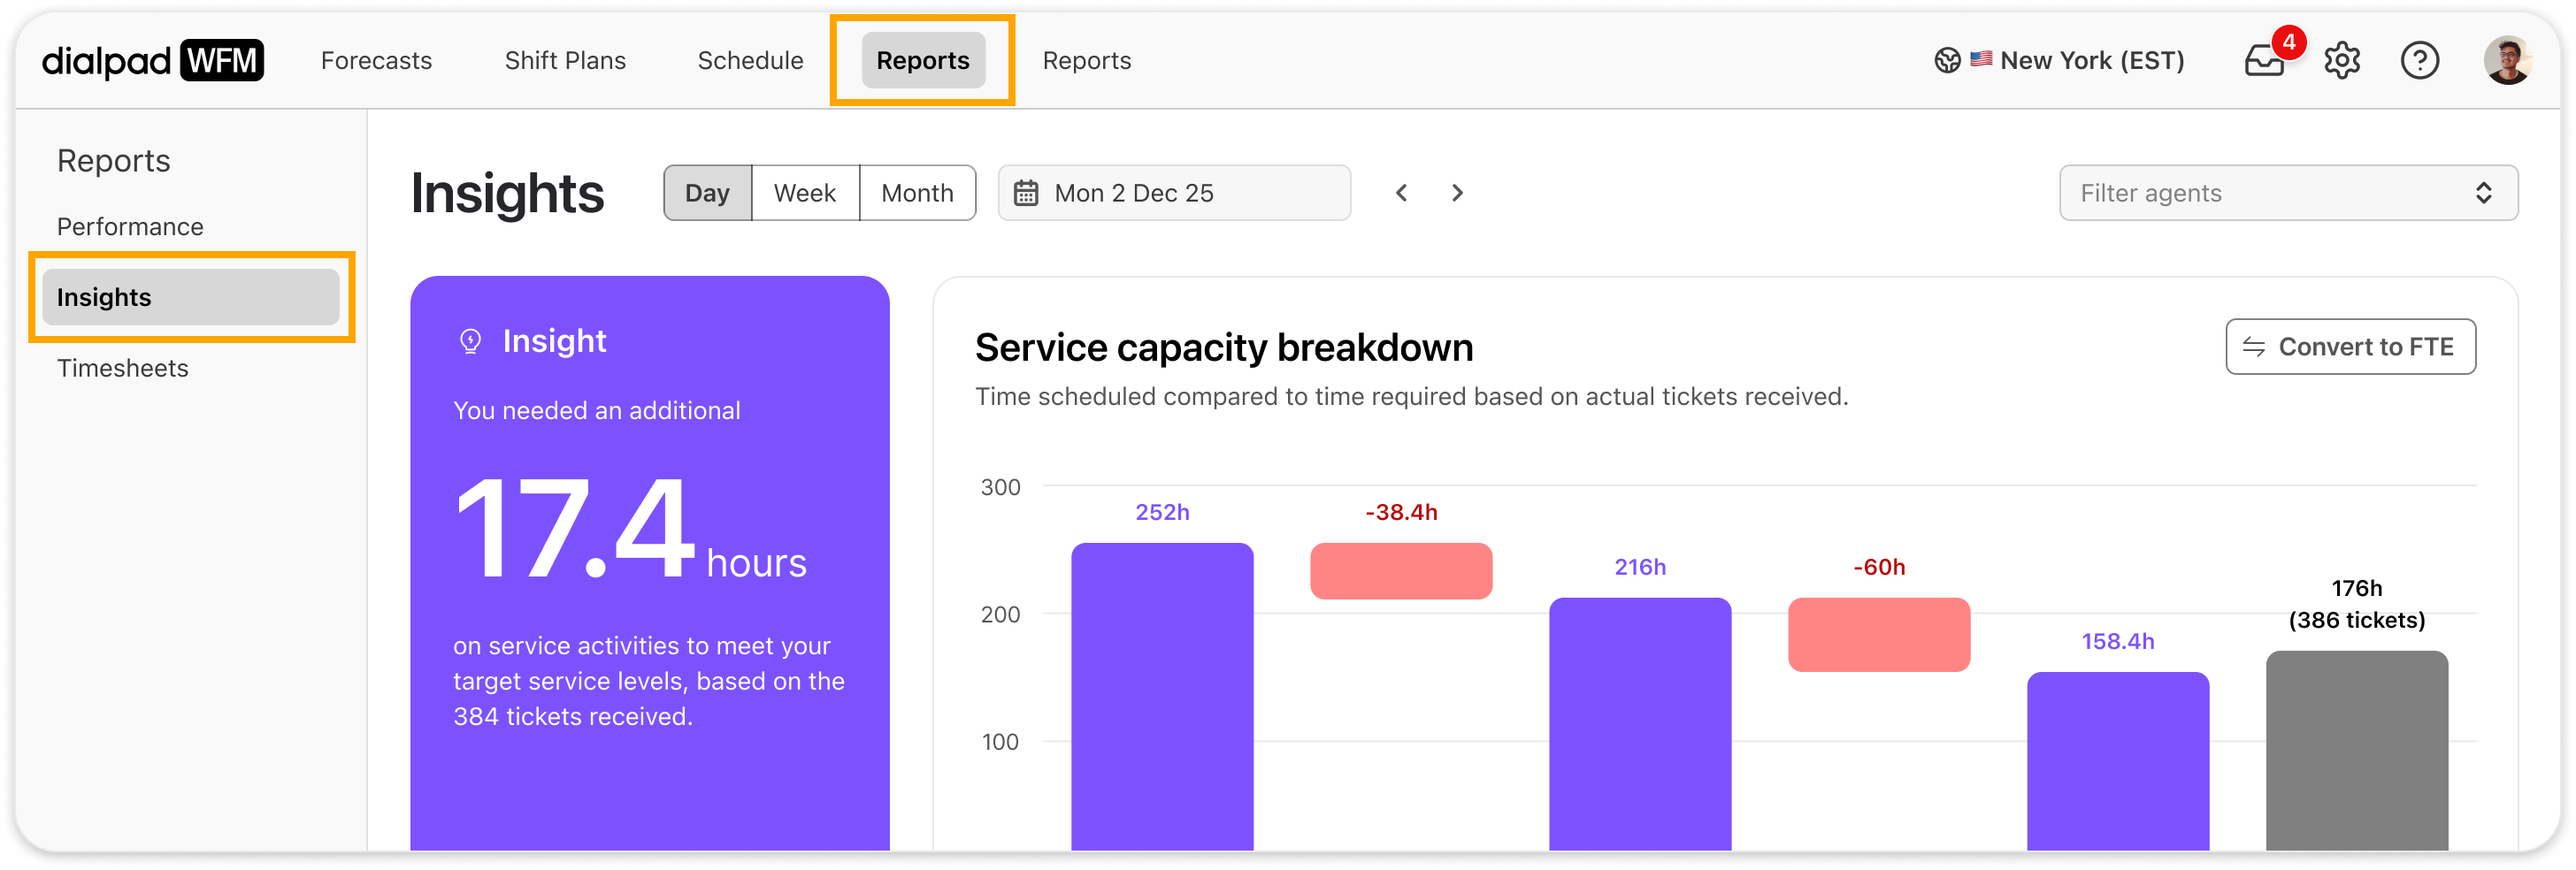
To access your team’s Insights Report, go to Dialpad WFM.
Select Reports
Select Insights
Filter the report
Use the filters at the top of the insights page to filter the report for different teams or periods of time.
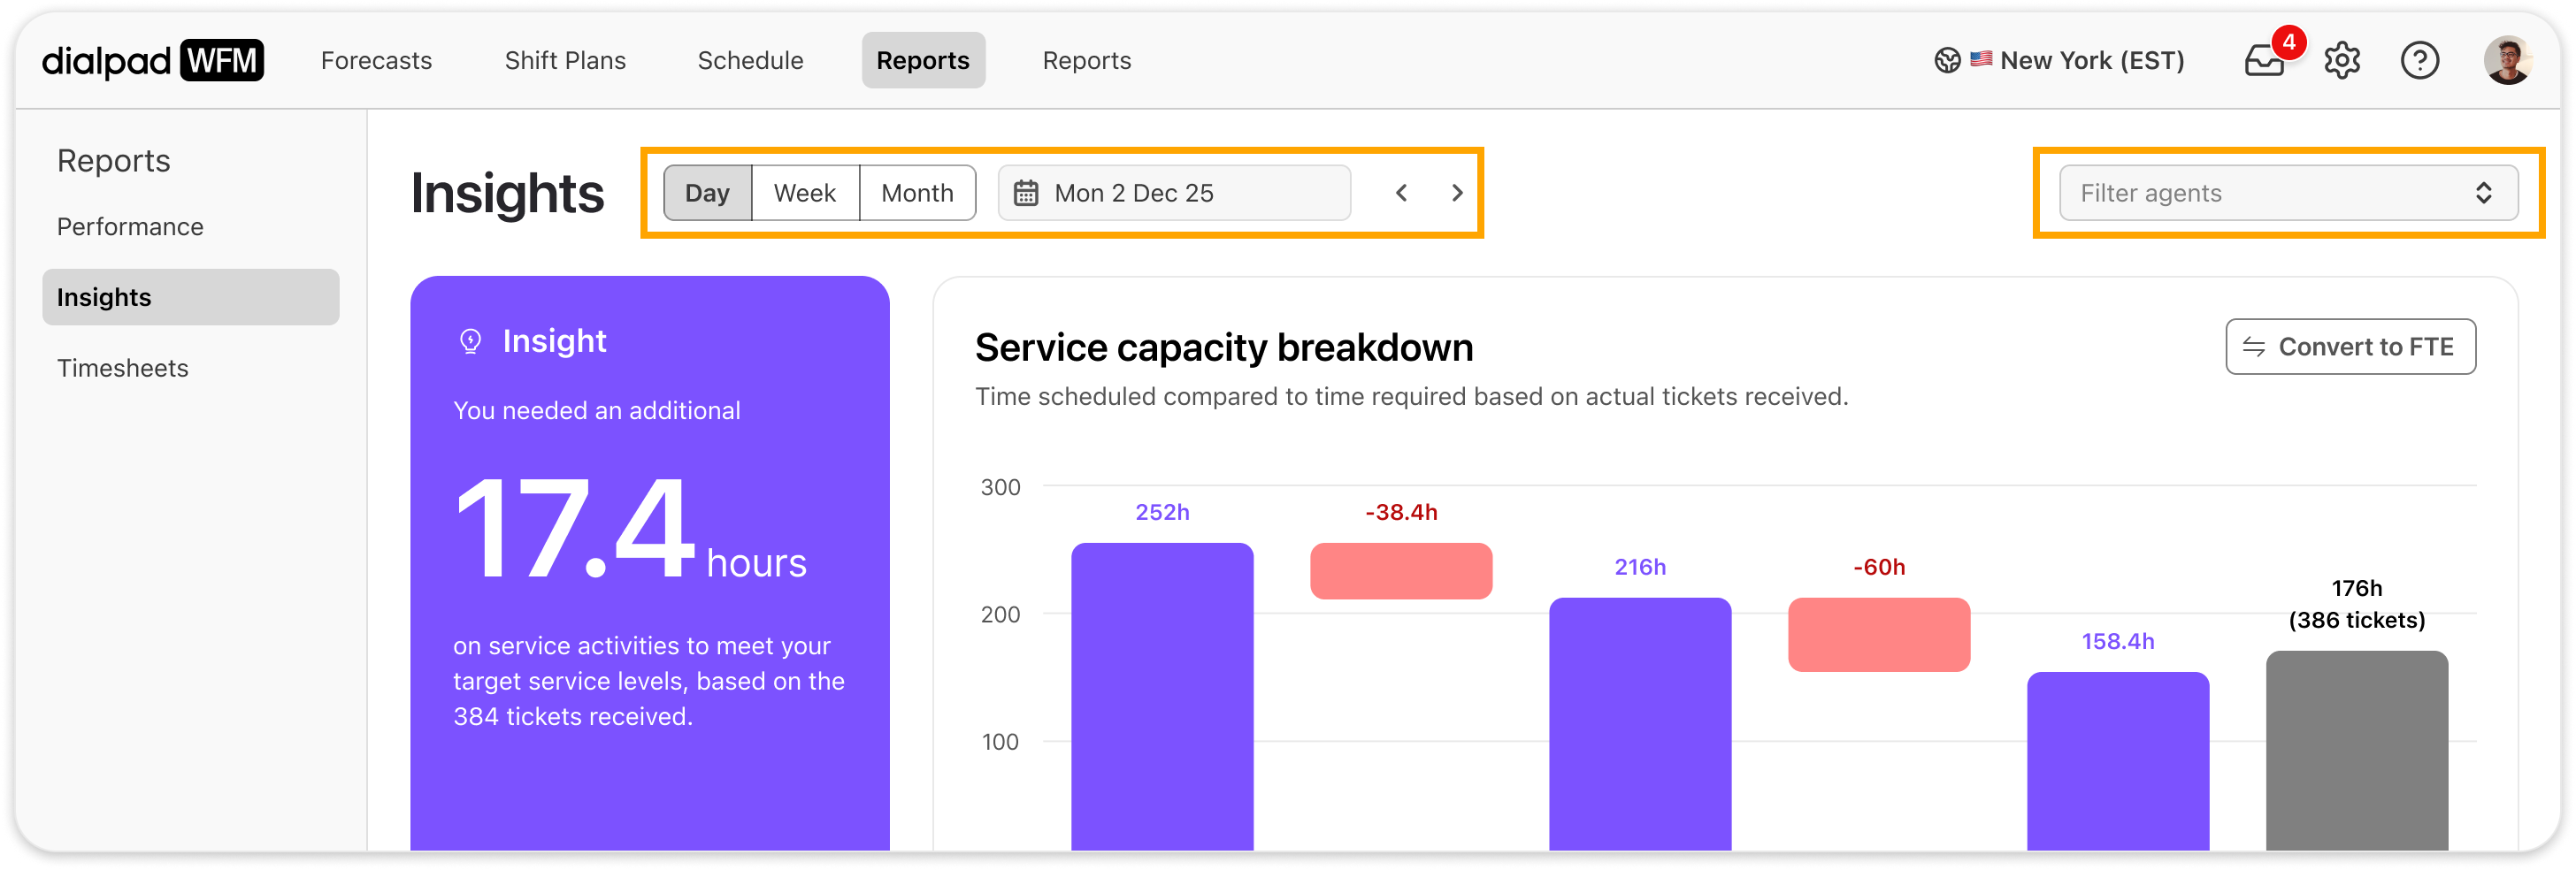
You can filter by:
Agents or team(s): Selects specific team(s) or agent(s). By default, all teams will be selected.
Day/Week/Month: Displays data by calendar days, weeks or months.
Date range: Displays data within the selected date range.
Use the left and right arrows to move forwards or backwards in time.
Tip
Use the global timezone picker in the top navigation bar to view the report in another timezone.
Understanding the report
The Insights Report provides a variety of data points to help you understand how effectively resource was used.
The report will only show data from published schedules.
When viewing dates in the future, the required time will be based on the total forecasted contact volume for all queues.
When viewing dates in the past, the required time will be based on the total actual received contact volume for all queues.

Service capacity breakdown
The service capacity breakdown provides a simple overview of where capacity has been lost across the planning process, alongside a comparison of your actual staffing vs required staffing.
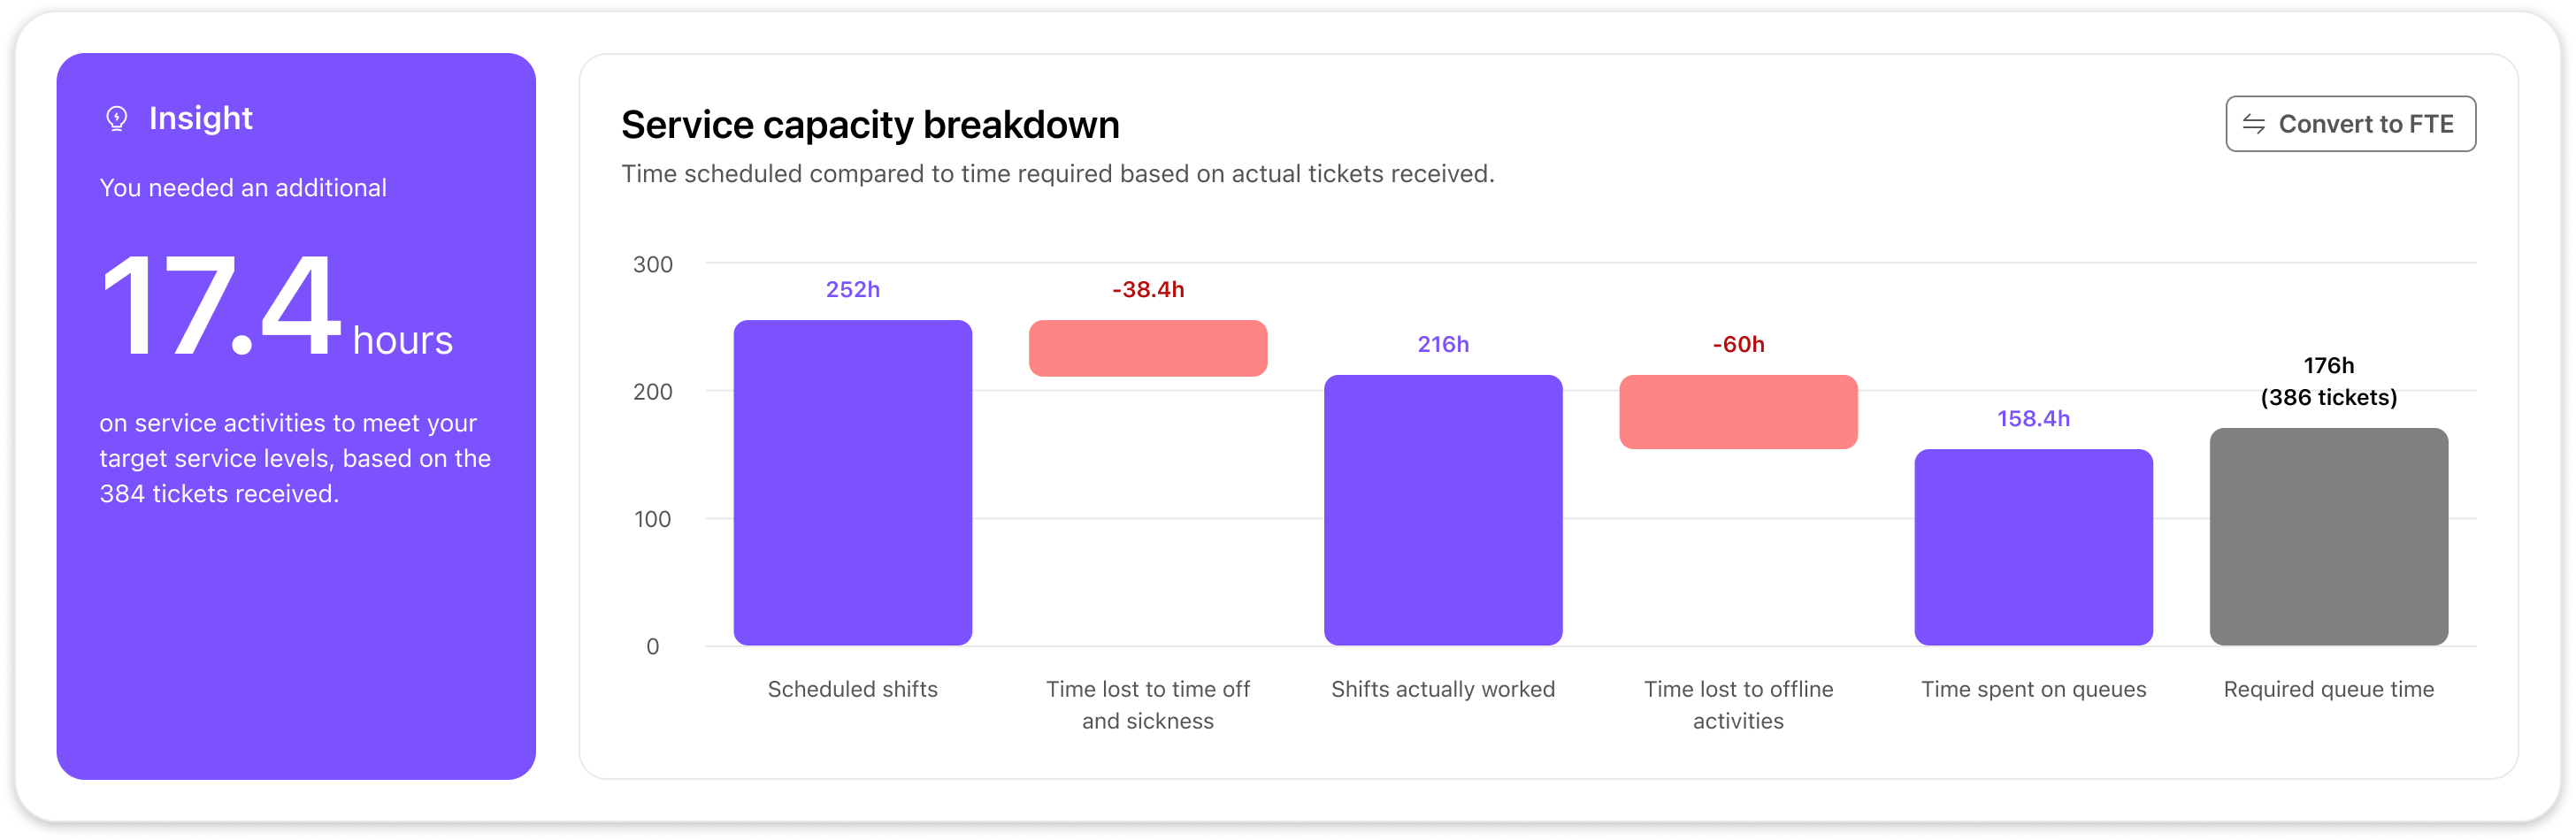
The insights card provides a simple summary of how under or overstaffed you were in this period.
This service capacity breakdown chart visualizes your external shrinkage (time lost to time off and sickness) and internal shrinkage (time lost to non-service tasks, breaks and meetings).
Scheduled shifts: total scheduled shift hours.
Time lost to time off and sickness: total scheduled shift hours removed by time off.
Shifts actually worked: total scheduled shift hours, less time off.
Time lost to offline activities: total time scheduled on offline activities or breaks within shifts.
Time spent on queues: total scheduled shift hours, less time off and offline activities or breaks.
Required queue time: total forecasted or actual required time on all queues to meet SLAs.
View data in hours or FTE (full-time equivalent)
You can choose to view data in hours or as a FTE to suit your needs.
To switch between views, select the convert to [FTE/hours] button within the service capacity breakdown chart.
To set the daily, weekly or monthly hours for an FTE in your company:
select convert to FTE within the service capacity breakdown chart
select 1 FTE equals x hours from the insights card
enter the relevant hours into the form and save
the calculation in the service capacity chart will now use these figures to calculate FTE
.png)
Time on queue activities and other activities
The next section in the report provides a breakdown of how time was scheduled across queue and offline activities.
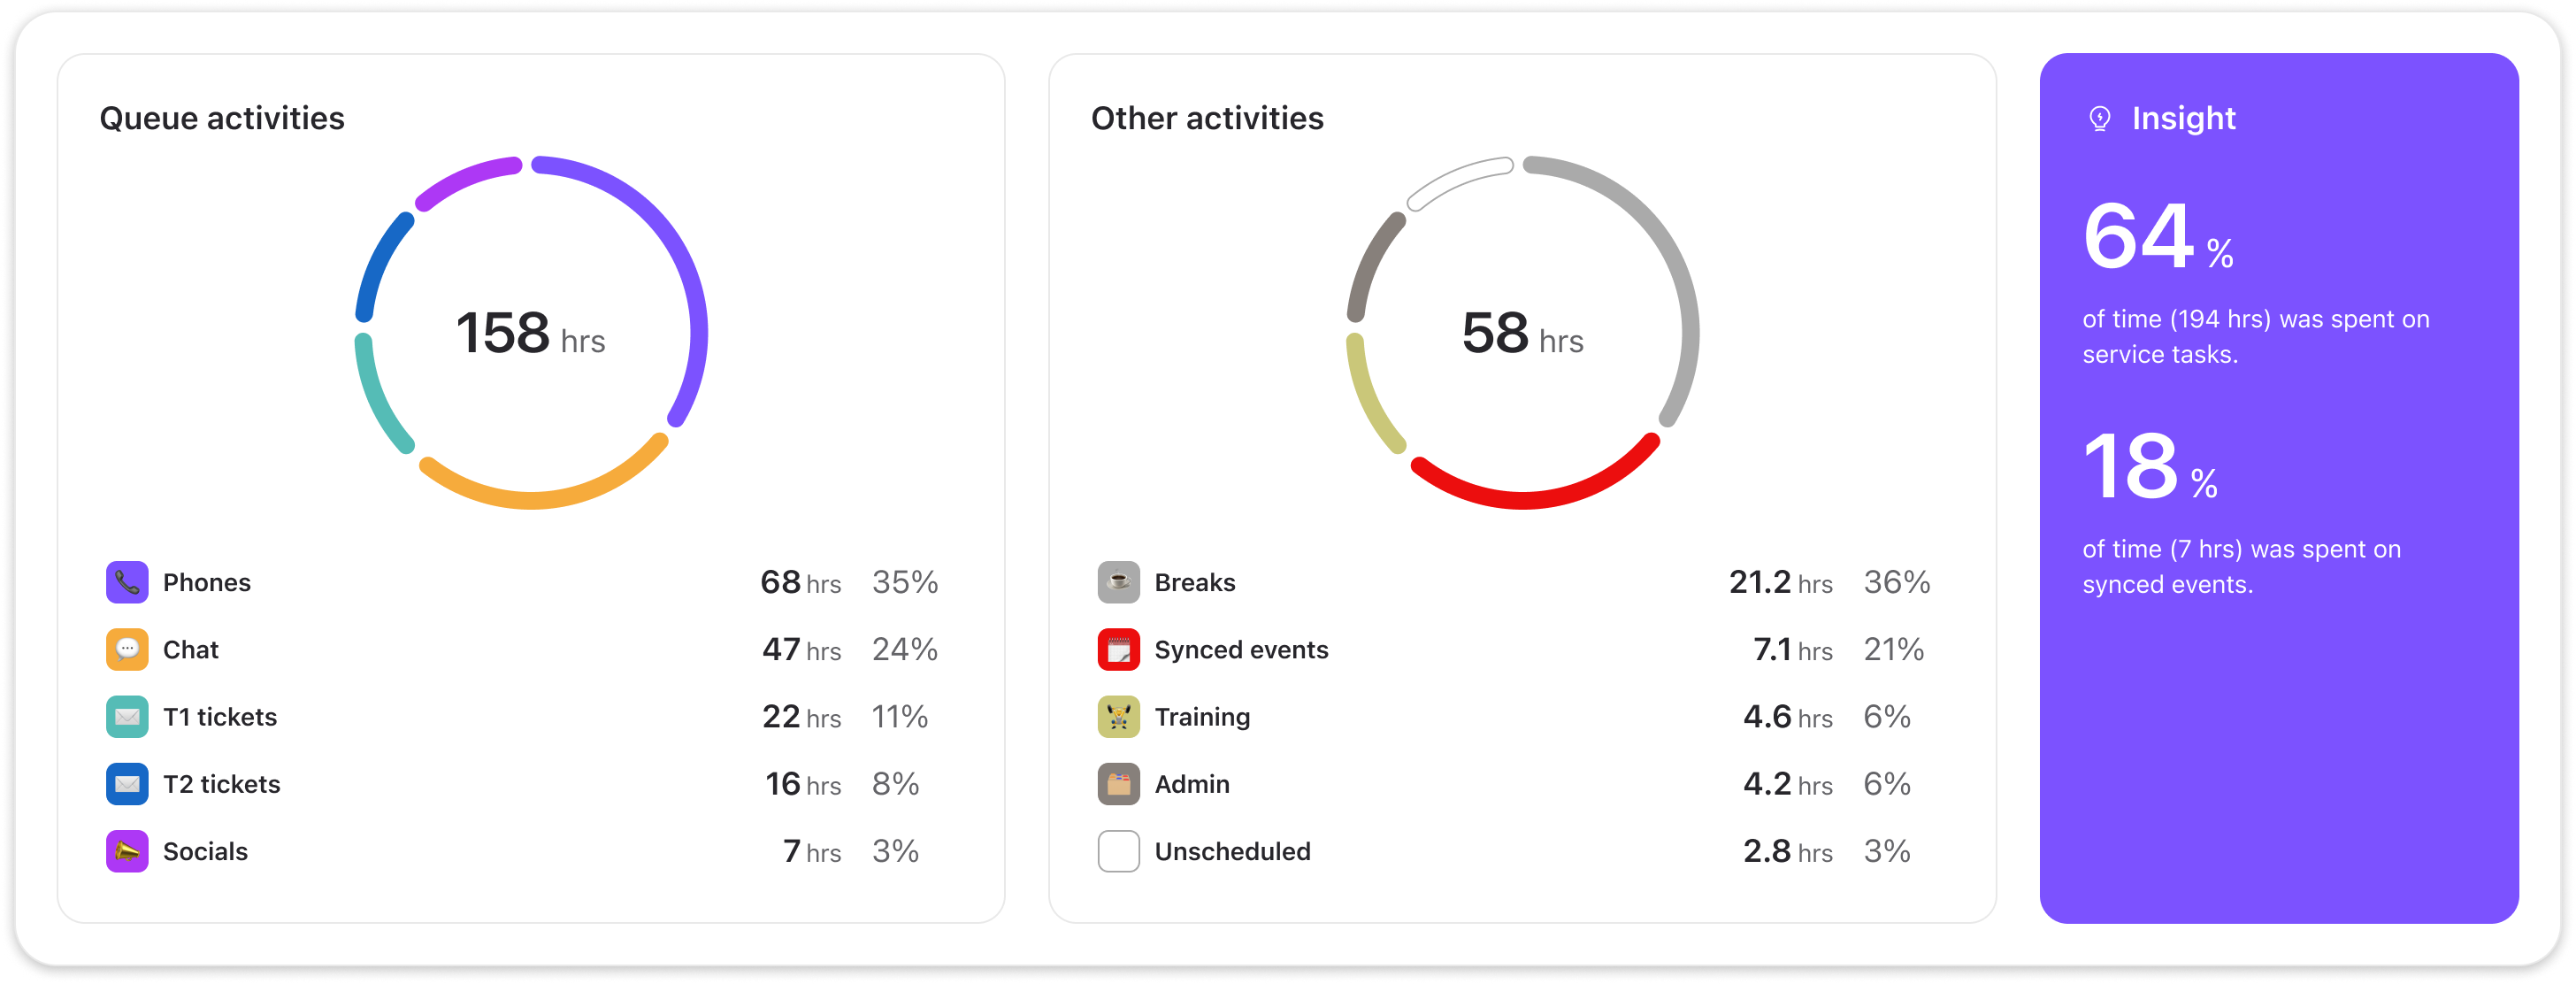
The queue activities card displays a summary of the total hours scheduled on queue activities, with a breakdown of hours and % per activity.
The other activities card displays a summary of the total hours scheduled on offline activities, unscheduled time, calendar events and breaks, with a breakdown of hours and % per activity.
The insights card provides two metrics:
the percentage of time scheduled on queue activities, also known as utilization.
the percentage of time scheduled on the offline activity or calendar event that represents the largest proportion of that group.
Coverage heatmap
The coverage heatmap displays the required coverage for all queues by hour for each day, allowing you to understand how well each queue was actually covered was across days, weeks or months.

The chart displays the net staffing for each interval, i.e. the difference between the scheduled staffing and required staffing. Hover over any interval to view a breakdown.
Data is presented differently depending on the range you are viewing:
Days: net staffing per queue per hour.
Weeks: net staffing per day per hour. In this view, all queues are totalled each day.
Months: coverage heatmap is unavailable for this view.
Frequently asked questions
How should I use the Insights Report?
The Insights Report helps you evaluate the effectiveness of your scheduling and identify areas to improve. For example:
You can use the service capacity breakdown chart to decide whether or not you can afford to approve time off.
You can use the coverage heatmap to identify patterns in over or understaffing which you can use to improve your shift or activity plans.
Update your shift plans: Moving the start or end times of shifts can allow you to achieve more even coverage.
Adjust activity rules: Extending your lunch window may provide you with better coverage.
You can use the service capacity breakdown to understand the impact of low utilisation, and the other activities card to identify activities to limit time on.
You can enter your team’s FTE data to more accurately measure shrinkage using the service capacity breakdown chart.
Why is there data missing from the insight report?
The insights report only displays data for published schedules. If you believe there is data missing, the schedule may not be published.
To publish the schedule:
Navigate to Schedule
Select Publish
Select the agents and date range you want to publish
Hit publish
Return to the insights report
What does unscheduled time mean?
Within the other activities card, you may see unscheduled time. This summarises the time within agents’ shifts where no activities, breaks or calendar events were scheduled.
How can I calculate shrinkage using this report?
You can use the data within the insights report to calculate shrinkage. Read our detailed guide to understand more.
How can I view the actual time agents spent on activities?
The insights report only displays data on scheduled time, not tracked or “actual” time.
To view agent activity or adherence compared to the schedule, visit the Performance report in Reports. Learn more about using the performance report.