In today's high-pressure contact centers, real-time performance insights are essential for agents and supervisors. Dialpad's Contact Center Launchpad goes beyond basic metrics, offering customized dashboards that provide a deeper dive into performance over time.
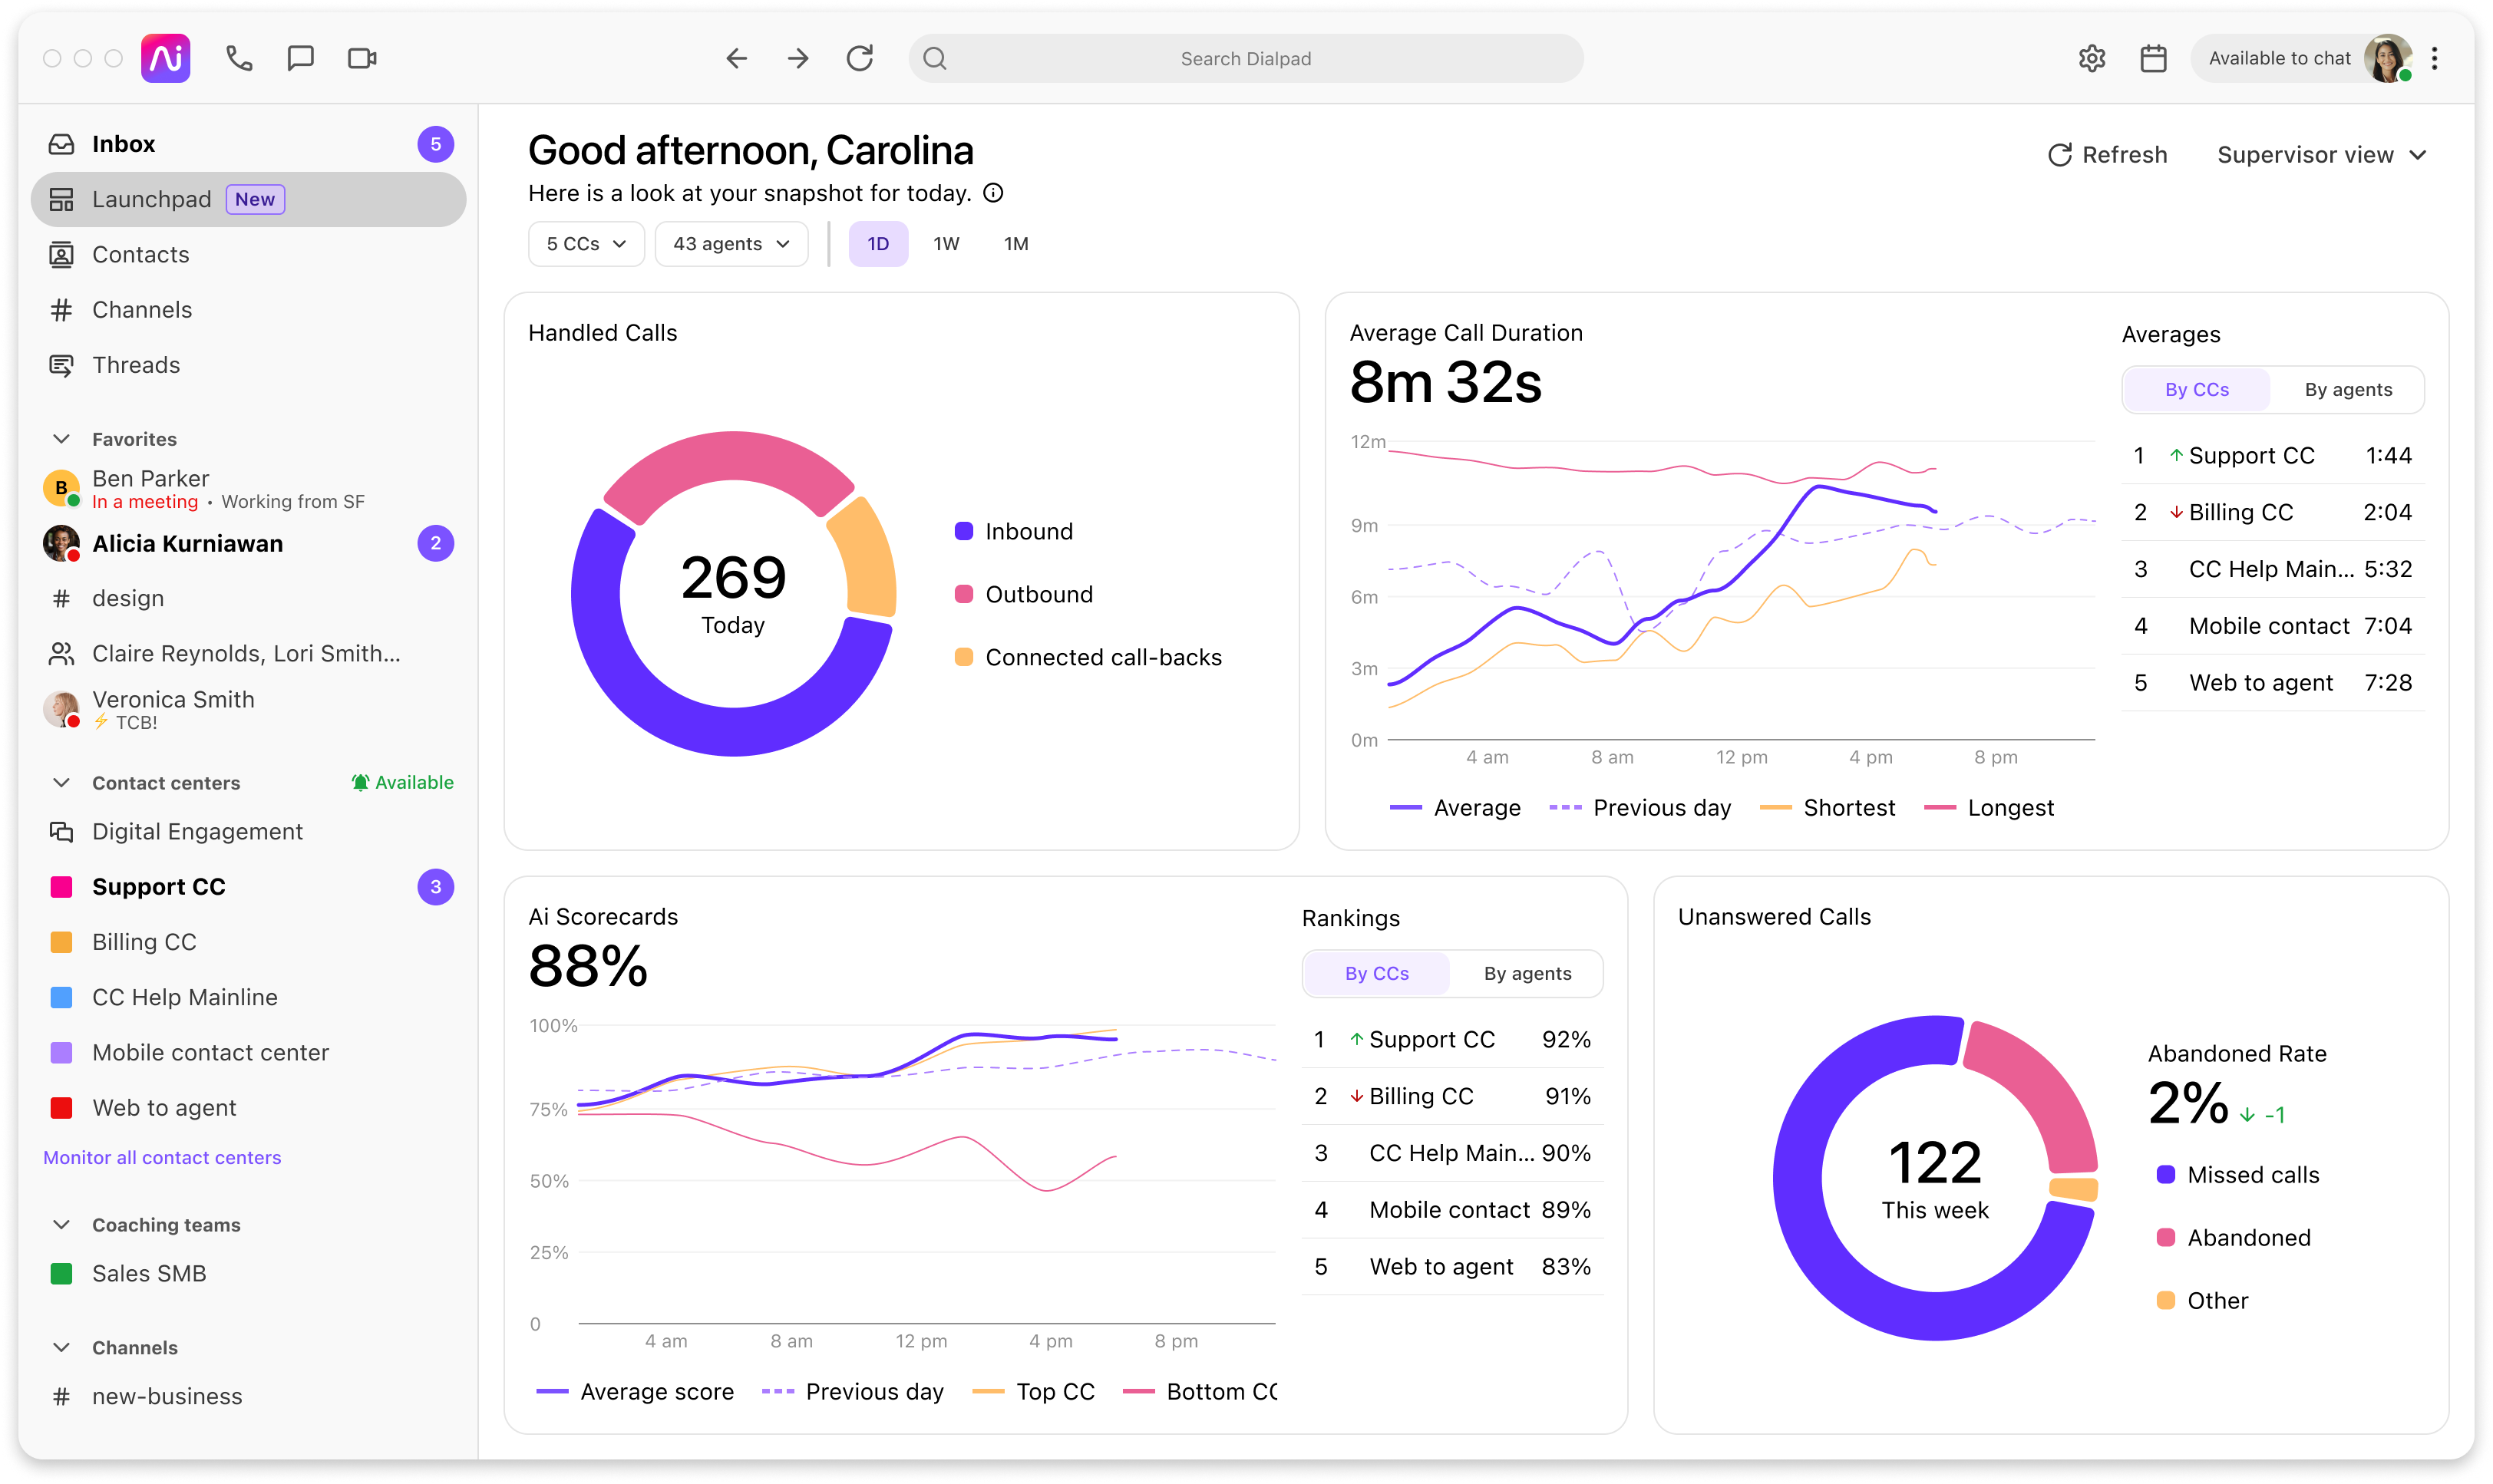
With tailored views for supervisors and agents, a performance leaderboard, and new widgets, this tool empowers teams to track progress, identify trends, and optimize performance.
Let’s dive into the details.
Who can use this?
Contact Center Launchpad is available to Dialpad Support users, as well as Dialpad Sell users with a Contact Center Add-On.
Access Contact Center Launchpad
To use the Contact Center Launchpad, you must be a Contact Center admin, supervisor, or agent.
Accessing the Contact Center Launchpad is easy; just select Launchpad from the sidebar of your Dialpad app.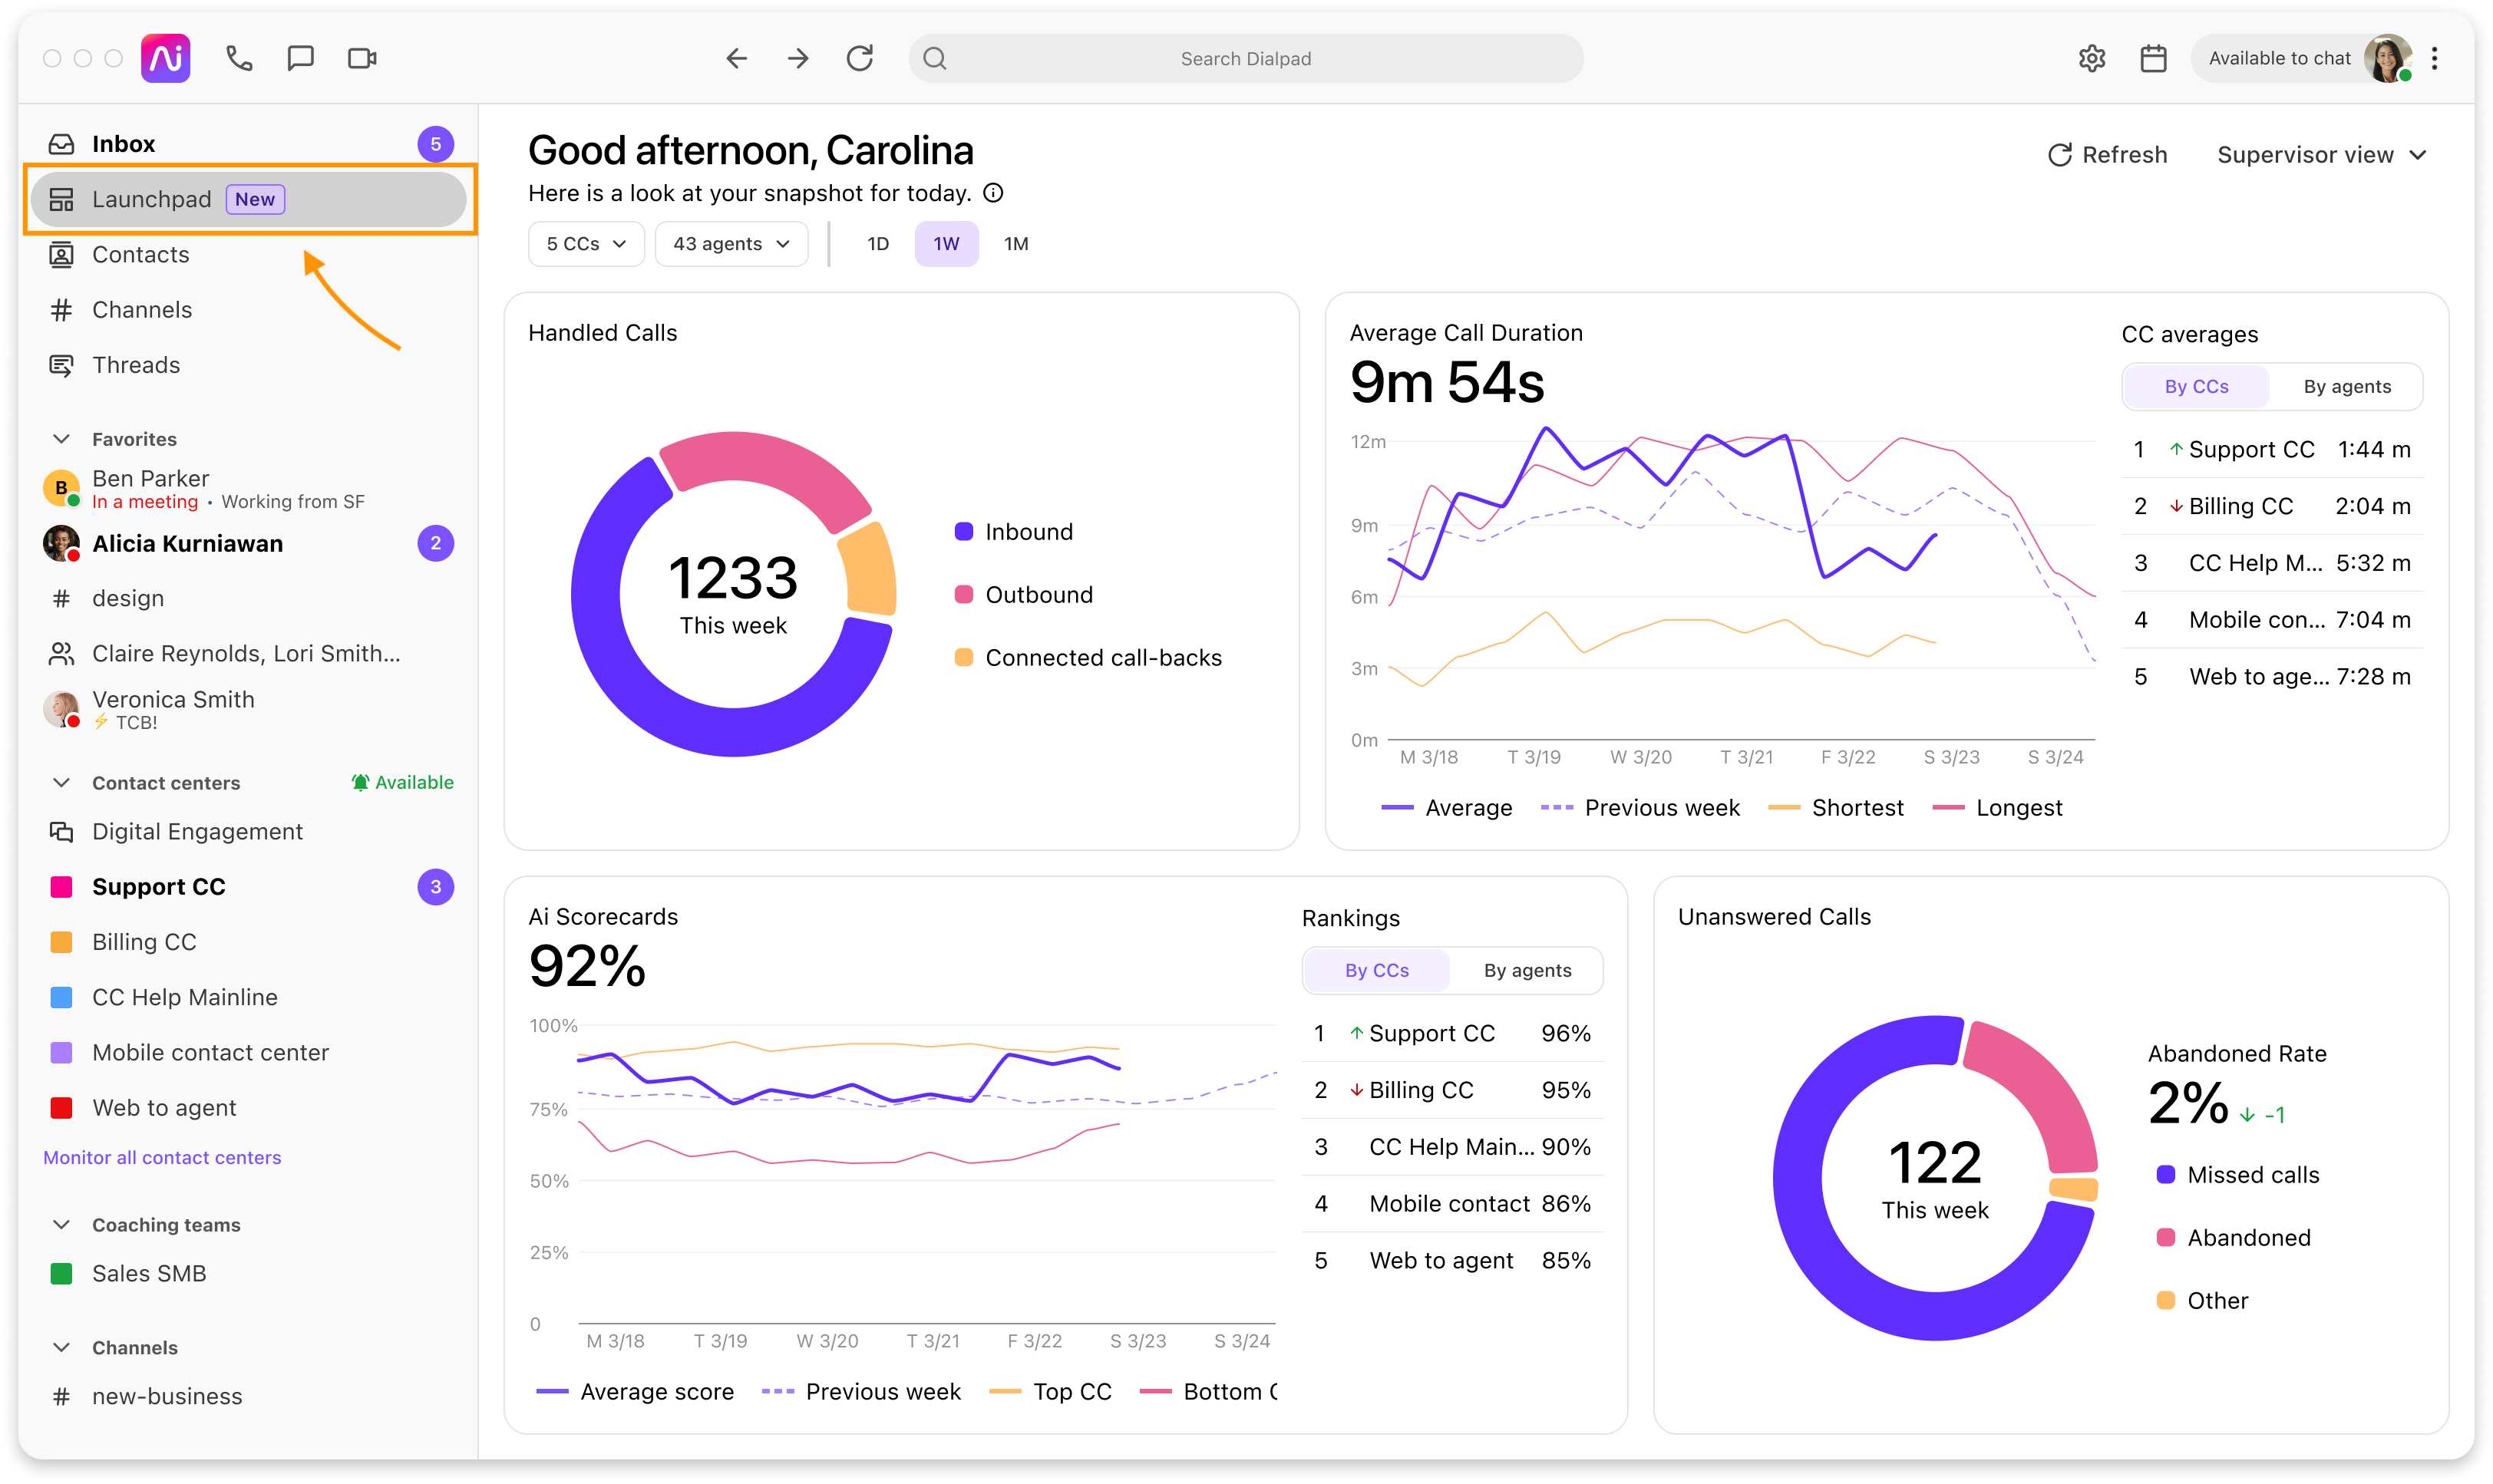
Using the Contact Center Launchpad
The Contact Center Launchpad offers two unique views, one for admins and supervisors, and one for agents.
While both views offer similar widgets, agents can only see their personal metrics, whereas admins and supervisors can see metrics for all their assigned agents and Contact Centers.
Note
If you’re a supervisor and/or admin in one Contact Center and an agent in another, you’ll see the supervisor view.
In both views, agents and admins/supervisors can filter the date and time, drill into daily scores, and choose to see leaderboards.
Date and time filters
All Launchpad data is shown in the user’s office timezone, with three available date and time choices:
Day (1D): Compares today vs yesterday.
Data is graphed in 4-hour intervals.
Week (1W): Compares this week vs the last week.
Weekly comparisons are based on a Monday through Sunday week, not a rolling 7-day period.
Month (1M): Compares this month vs last month.
Monthly comparisons are based on a true calendar month, not a rolling 30-day window.
Data is graphed in weekly intervals.
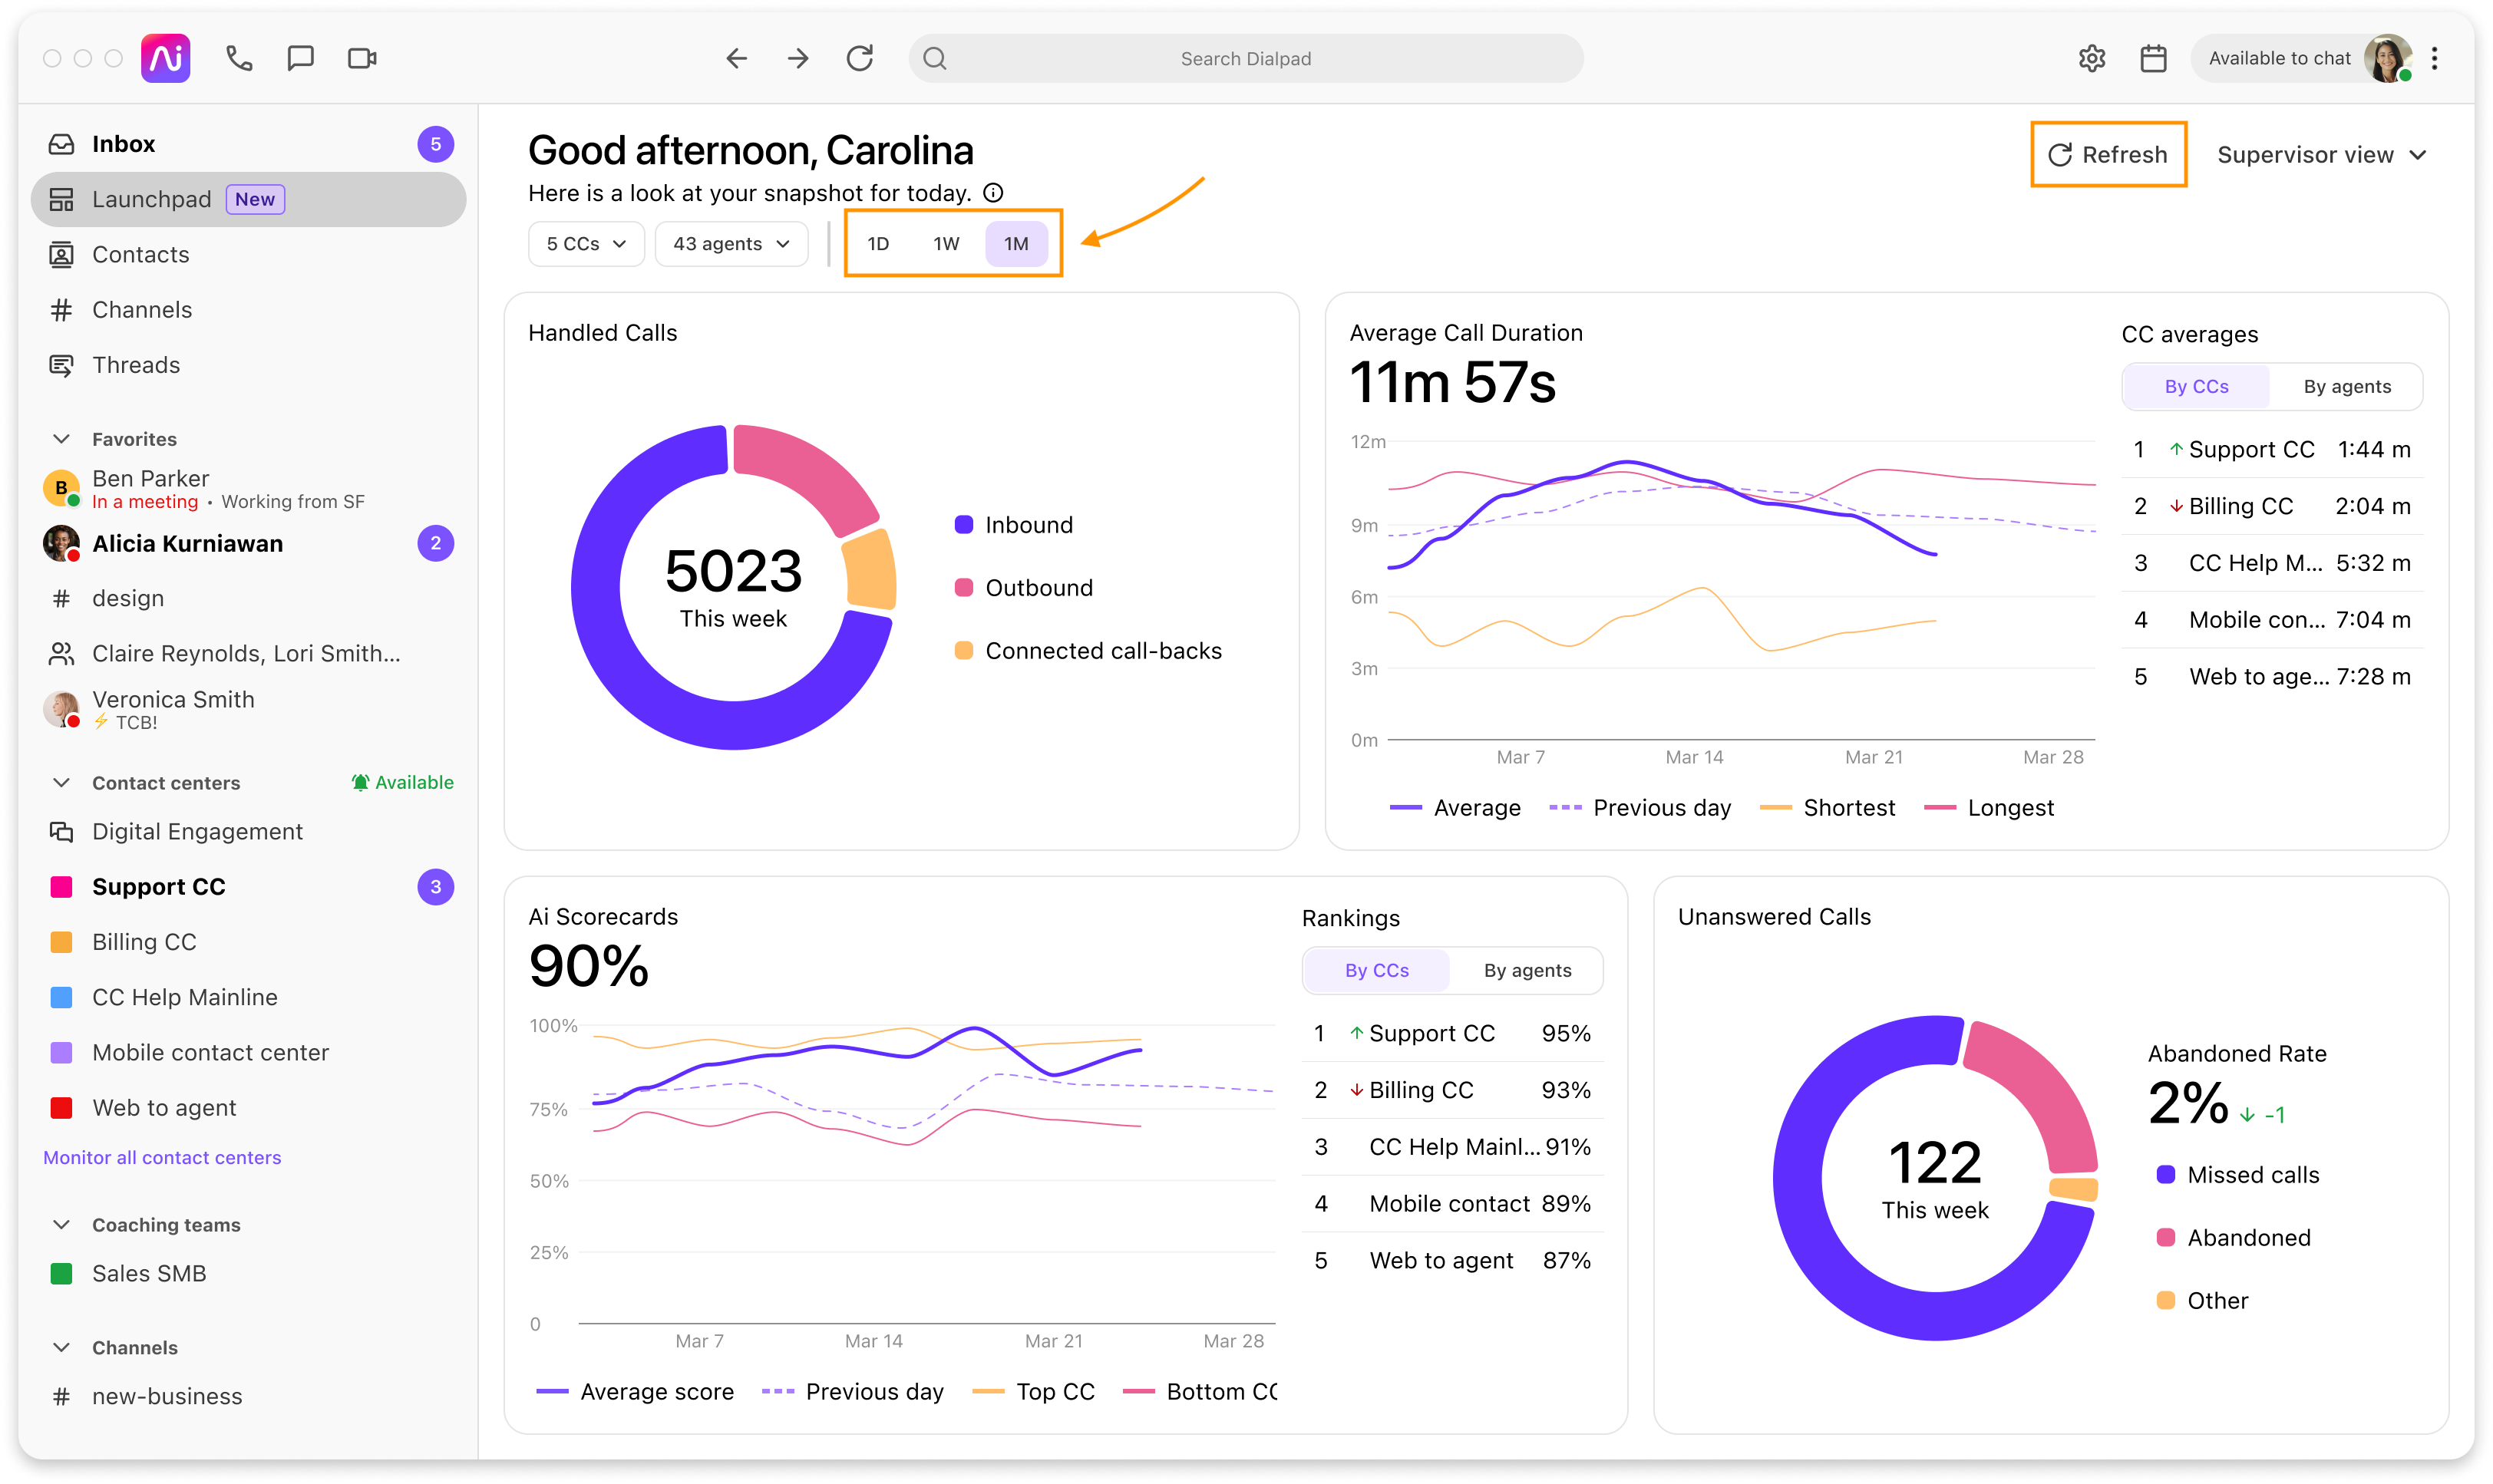
Filter data by day, week, or month by selecting the time filter buttons at the top of the Launchpad.
Data is displayed in real-time and refreshes every 2 minutes. Or, you can select Refresh to manually update your Launchpad.
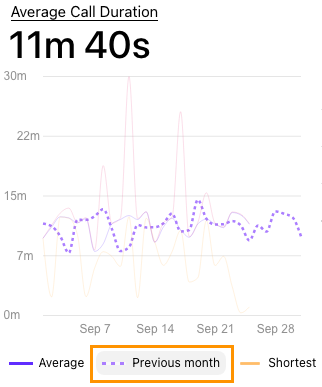
Tip
On the line-graph widgets, you can also filter specific data points within the widget.
Drill into the data
Each widget contains a pie chart or a line graph with unique data sets.
Hover over any data point to access detailed totals and comparisons.
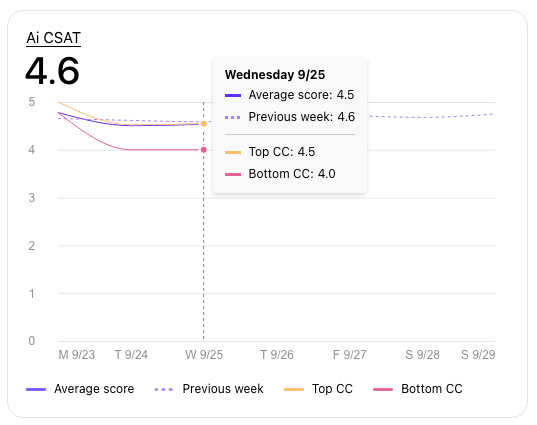
Tip
Hover over a metric name to isolate it and temporarily hide other lines.
Select the metric's name to hide it completely. To view it again, simply click on its name once more.
Launchpad widgets
The Contact Center Launchpad features 5 distinct widgets, each tailored to the specific needs of admins, supervisors, and agents.
Some widgets offer rankings, an easy way to compare agent and contact center performance.
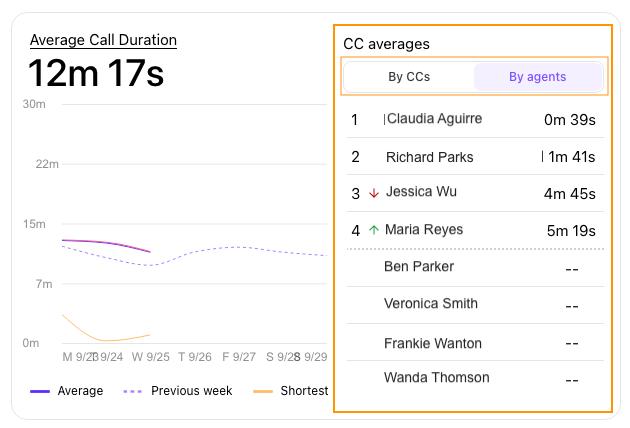
Supervisors can view rankings based on overall Contact Center performance or individual agent performance. Agents can see their own ranking within their Contact Center(s).
Let’s look at each widget.
Average Call Duration Widget
The Average Call Duration Widget displays the average call duration in an easy-to-read line graph.
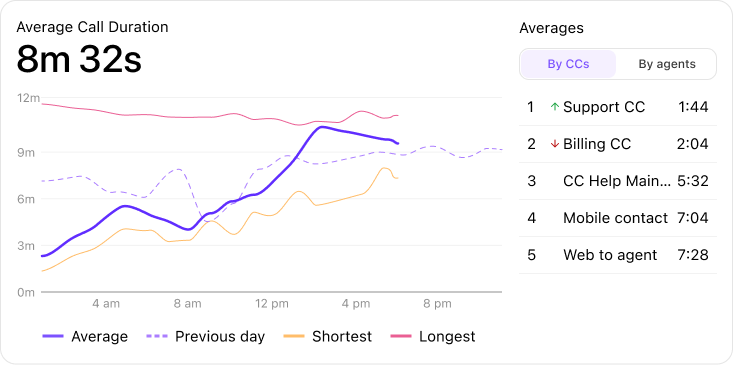
Supervisors can view real-time average call duration for their Contact Centers or agents, compare to historical performance (previous day, week, or month), and identify top and bottom performers.
Agents can view their average call duration across all contact centers, along with their individual rankings. The 'Your averages' section provides a breakdown of agent performance across different contact centers, ranked from shortest to longest call duration. Agents can also see their overall average, as well as their shortest and longest call durations for the current day, week, or month.
Handled Calls Widget
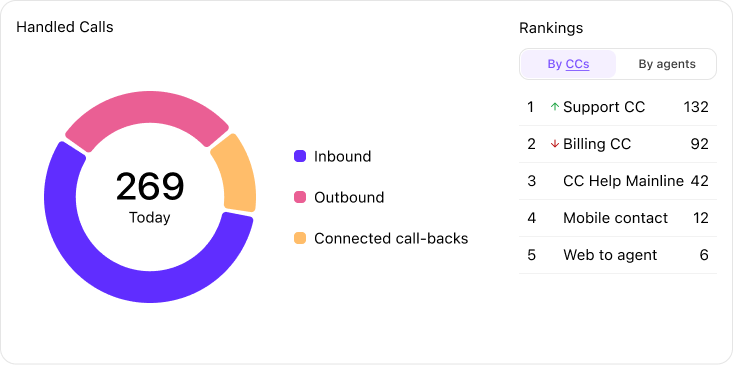
The Handled Calls widget is available to supervisors and admins only. It provides a total count of inbound, outbound, and connected callback calls across all supervised contact centers. Hover over each pie slice to view current, previous, minimum, and maximum values.
Note
Contact Center rankings will only appear on the Handled Calls Widget if the supervisor manages more than one Contact Center.
Your Calls Widget
The Your Calls Widget is available only in the agent view, and provides a total count of their inbound, outbound, connected callback, missed, and rejected calls across their Contact Centers.
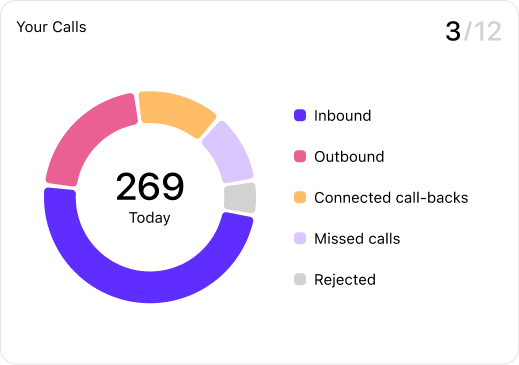
The number on the top right is the agent’s overall ranking among their teammates.
Unanswered Calls Widget
The Unanswered Calls Widget is only available to supervisors. It shows missed, abandoned, and other unanswered calls across all supervised Contact Centers, as well as the overall abandon rate.

Supervisors can view overall totals and individual Contact Center or agent rankings.
Note
The total count in the pie chart may not always match the agent rankings due to fan-out calls.
Agent Status Widget
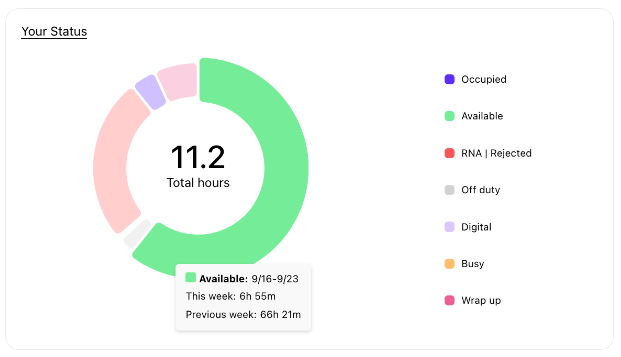
The Agent Status Widget is only available in the agent view. It displays the agent’s total time spent in each of the following statuses:
Occupied
Available
RNA | Rejected
Off Duty
The off-duty count excludes the generic off-duty status and only includes time spent in custom off-duty statuses.
Digital
This status will only appear if the agent is a member of a Digital Contact Center.
Busy
Wrap Up
 Ai CSAT Widget
The Ai CSAT Widget displays the overall average Ai CSAT and manual CSAT score.
If you do not have Ai CSAT, this widget will only show manual survey scores.
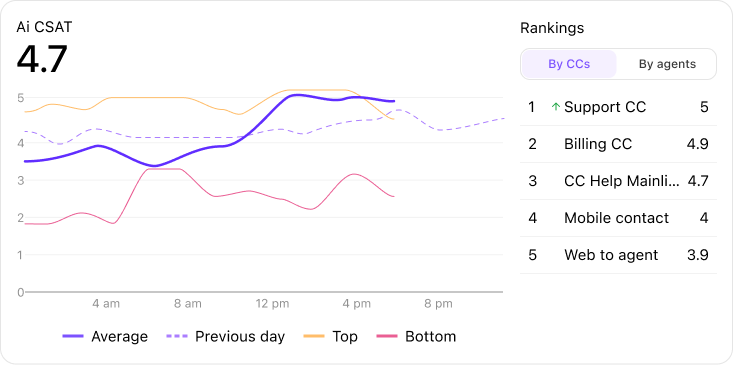
The Supervisor View displays the overall average Ai CSAT score across all supervised Contact Centers. Ai CSAT combines both AI-generated and manually-provided customer scores. Supervisors can also view top and bottom performers for Contact Centers and agents.
Note
Rankings are available for supervisors managing multiple Contact Centers. For supervisors managing a single Contact Center, only agent rankings will be displayed.
The Agent View displays the overall average Ai CSAT score across all Contact Centers, along with a breakdown of individual contact center scores. Rankings indicate the agent's position among all agents within their Contact Centers, as well as the scores of the top and bottom agents.
 Ai Scorecard Widget
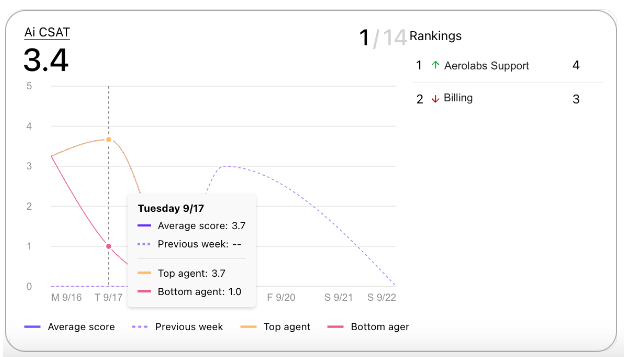
The Ai Scorecards Widget displays the overall average Ai Scorecard grade for AI and manually graded scorecards.
The Supervisor View displays the overall average scorecard grade for their supervised Contact Centers. This includes both automated and manually provided scores. Supervisors can view rankings for top and bottom-performing contact centers and agents, as well as current and historical averages.
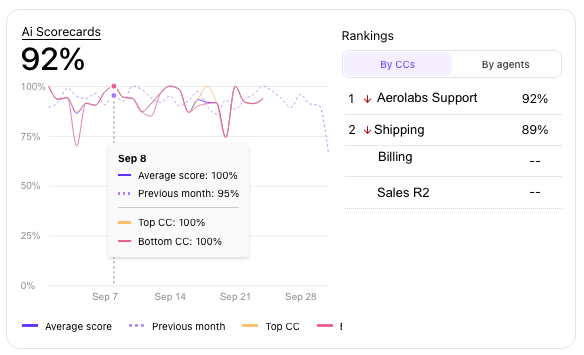
The Agent View displays the agent’s overall average scorecard grade across their Contact Centers. It also shows a breakdown of individual Contact Center scores, with rankings indicating the agent's position among peers. The widget includes current and historical average scores, as well as top and bottom agent performers.
Frequently asked questions
What if I don’t want to see the rankings?
For those who prefer a leaderboard-free experience, we've made it easy to hide rankings. Hover over the widget and select Hide list.
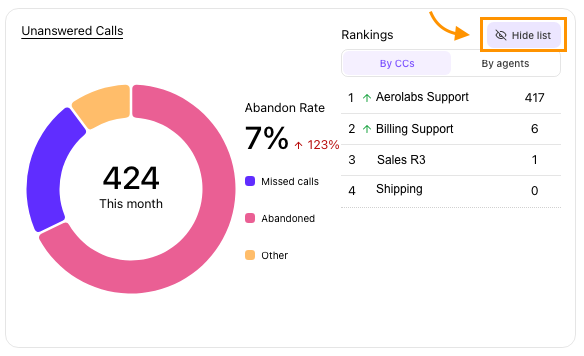
To show the rankings again, hover over the widget and select Show list.
Can I switch between the Supervisor and Agent Views?
Not yet, but this functionality is coming soon. If you’re an agent in one Contact Center and a supervisor in another, your Launchpad will default to the Supervisor View.
Can I pick which widgets I want to see?
Yes. To change which widgets are visible:
Select Edit
Select who’s widgets you’re adjusting
Your view updates which widgets you’ll see
Your agent’s view updates which widgets your agents will see (only visible to admins)
Select the eye icon to hide or display a widget
Select Apply
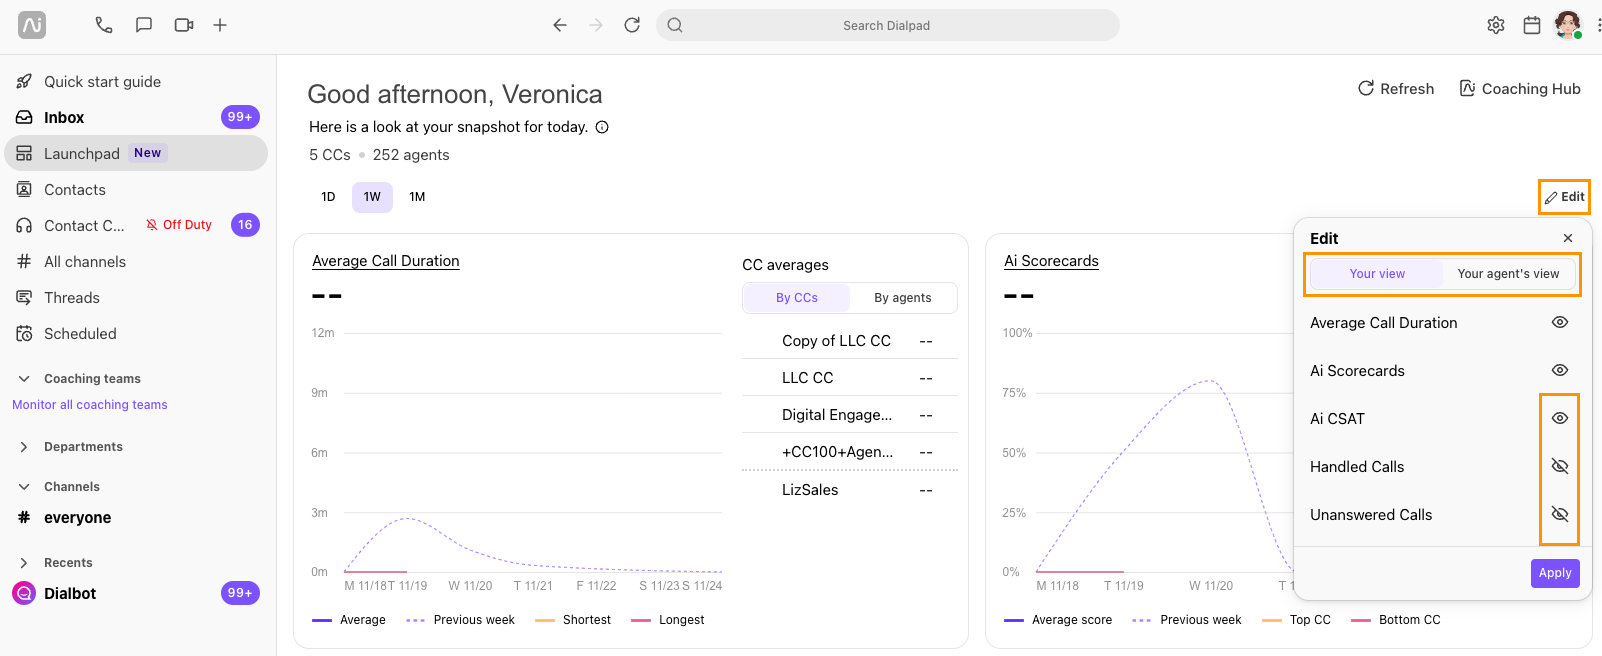
By default, agents can only see three widgets: Your Calls, Average Call Time, and Your Status.
To enable the Ai CSAT or Ai Scorecard widgets for agents, a Contact Center or Office Admin must activate them (supervisors have read-only access and cannot edit viewing permissions).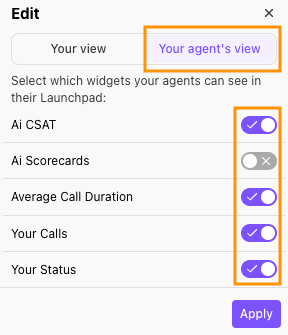
How are averages calculated?
All averages (scorecards, CSAT, average call duration) are calculated based on the total number of calls. This aligns with standard analytics practices.
For example, the average call duration for a team with 101 calls (100 calls of 6 minutes and 1 call of 2 minutes) would be 5.96 minutes.
Why don't the agent ranking numbers for unanswered calls always match the total count in the pie chart?
Agent rankings are based on individual agent call counts, while the main total reflects the overall group call count. Some calls may involve multiple agents (fan-out calls), leading to discrepancies between individual agent rankings and the overall total.
Why is the average number in the left corner of the widgets different than the average number in the hover-over?
The large average number is the aggregate average across all your Contact Centers for the selected time period. The hover-over number displays what the average was for that specific time. The averages may be different due to the overall average calculation, which considers historical data displayed on the chart.
Why don’t I see all my calls (or all of an agent’s calls) on the Contact Center Launchpad?
The Contact Center Launchpad only displays calls made using contact center phone numbers. Calls made with personal phone numbers will not appear in the Launchpad's data.
