The Contact Center Dashboard presents key metrics in an intuitive visual format that is easy to interpret. It offers enhanced flexibility through extensive customization options, allowing users to apply up to 17 activity filters, narrow views by specific Contact Center, and define custom time ranges.
Additionally, dashboards can be saved for later reference, enabling quick access to personalized views that support efficient, data-driven decision-making.
Let's dive into the details.
Who can use this
Contact Center Dashboards are available to Dialpad Sell and Dialpad Support customers on Advanced and Premium plans.
View Contact Center dashboard
To view your Contact Center dashboard, go to the Dialpad Admin portal.
Select the Live Dashboard
.png)
Select Contact Center
Filter your dashboard
Before customizing your dashboard, you can apply filters to ensure you’re viewing data for specific contact centers, channels, and time periods.
To filter your dashboard, select the desired filter(s), then choose which data you want to see.
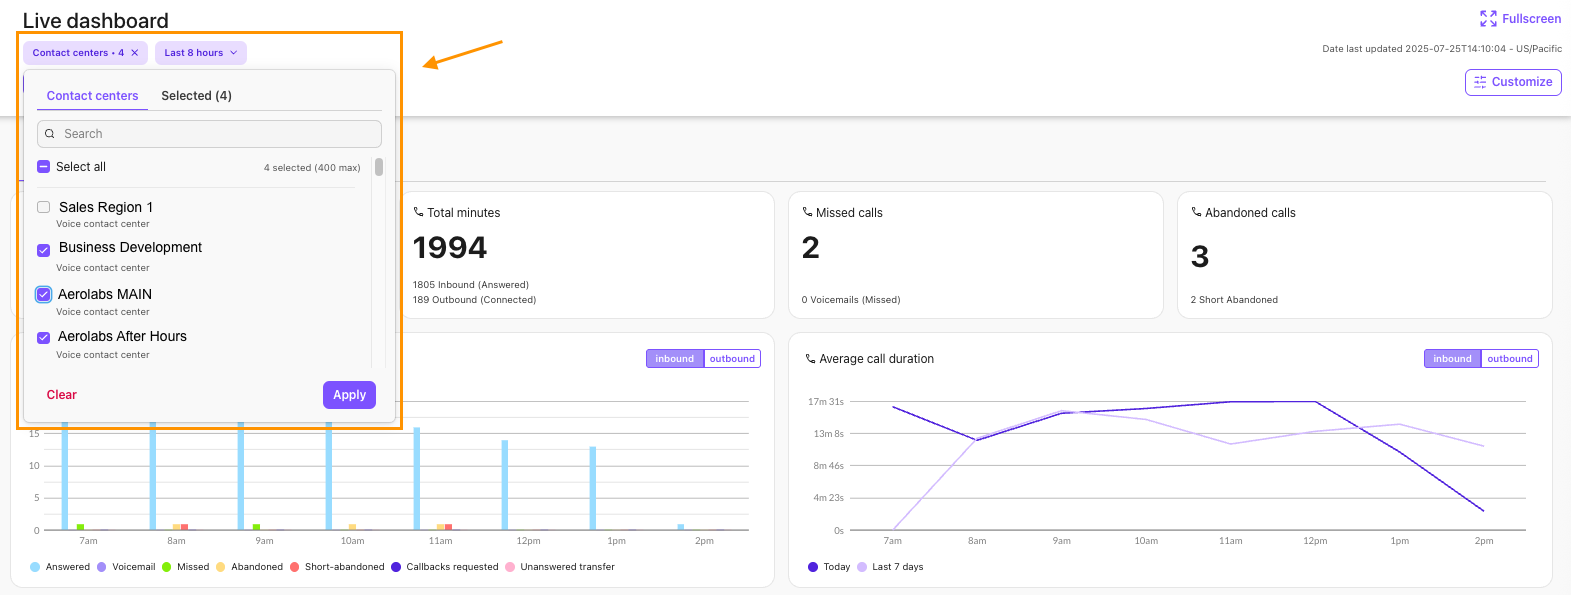
Notes
The Channels and Expertise filter will only appear if you have selected a Digital Contact Center.
Metrics categorized and labelled as Live are calculated based on their present status, and are independent of the timeframe chosen.
Customize the Live Dashboard
Dashboards can be customized by adding and removing widgets, or by specific data points.
To customize your Live Dashboard:
Go to the Live Dashboard
Select Customize
.png)
Hide or view a widget by selecting the eye icon
Select Apply
.png)
Tips
Use the search bar to quickly find a specific widget.
Drag and drop widgets into different positions on the screen.
The following data points are available to be viewed or hidden:
Service level (SLA) per channel | Active agent sessions |
Abbreviated name | Session capacity |
Queued calls | Survey engagement |
Longest wait time | Survey CSAT score |
Agents: Available | Total agent sessions |
Agents: On a call | Automated sessions |
Agents: wrap-up | Customers queued |
Agents: Busy | Deflection rate |
Total inbound calls | Automation sessions by channel |
Answered calls | Agent sessions by channel |
Abandoned calls | Ai Agent answer feedback |
Missed calls | Ai Agent queries |
Voicemails | Ai Agent answers |
Outbound connected | Total minutes |
Canceled calls | Average call duration (ACD) |
Average speed to answer (ASA) |
Fullscreen view
Dialpad's built-in dashboard includes a full-screen option, which can easily be projected onto a large monitor in a physical, in-person setting.
Select the Fullscreen button and just like that, the dashboard will fill your entire screen.
.png)
Save a dashboard
Save your customized dashboard so that you don't have to reset your filters each time.
To save a dashboard, go to the Live Dashboard, select the desired filters and select Save dashboard. 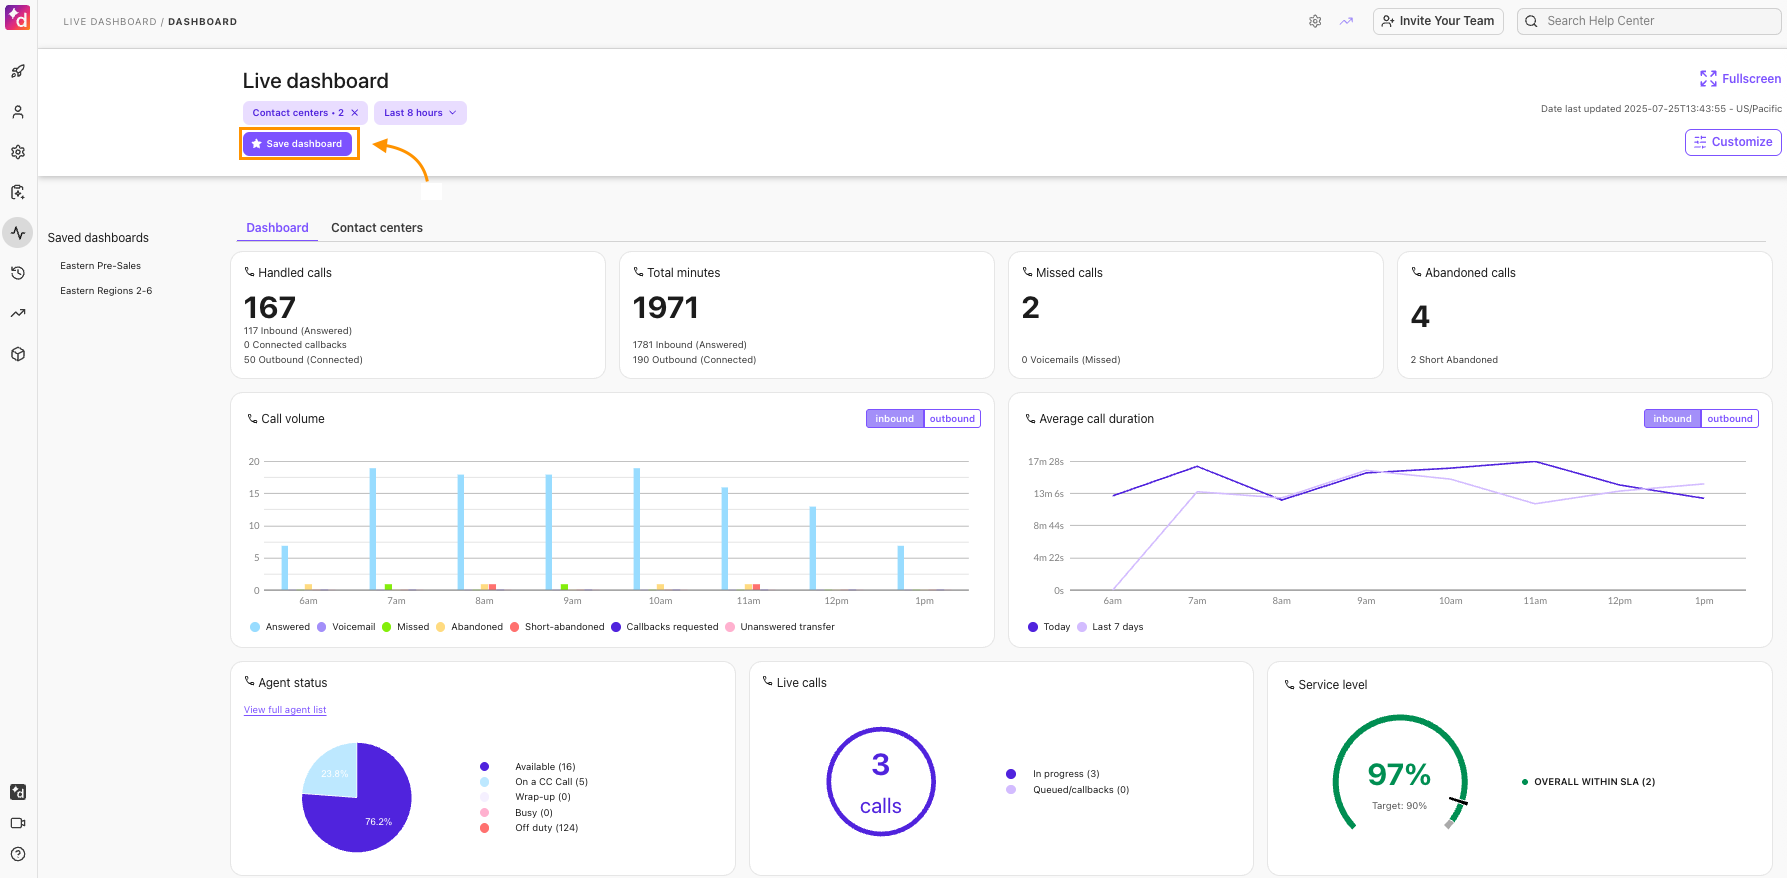
That's it! Your saved Live dashboard will now appear in the Saved Dashboards section, ready to be viewed again at your leisure. 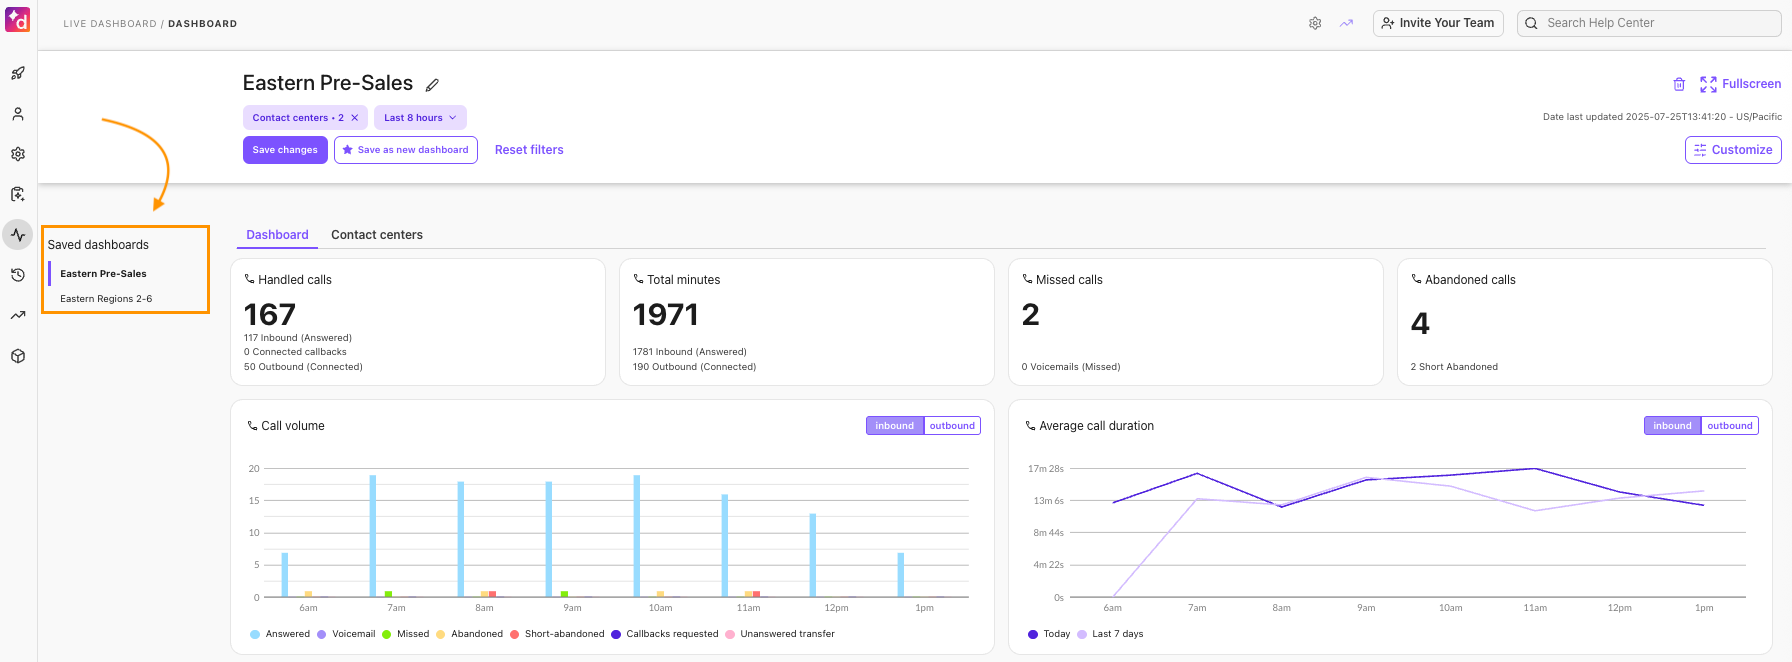
Edit a saved dashboard
Need to make changes to a saved dashboard? No problem.
To edit a saved dashboard, go to the Dialpad Admin Portal
Select Live Dashboard
Go to Saved Dashboards
Select the dashboard
Add or remove any applied filter(s)
.png)
Select Save changes or Save as new dashboard
The Dashboard will automatically update.
Delete a saved dashboard
To remove a saved dashboard, select the dashboard you'd like to remove, then select the trash can icon.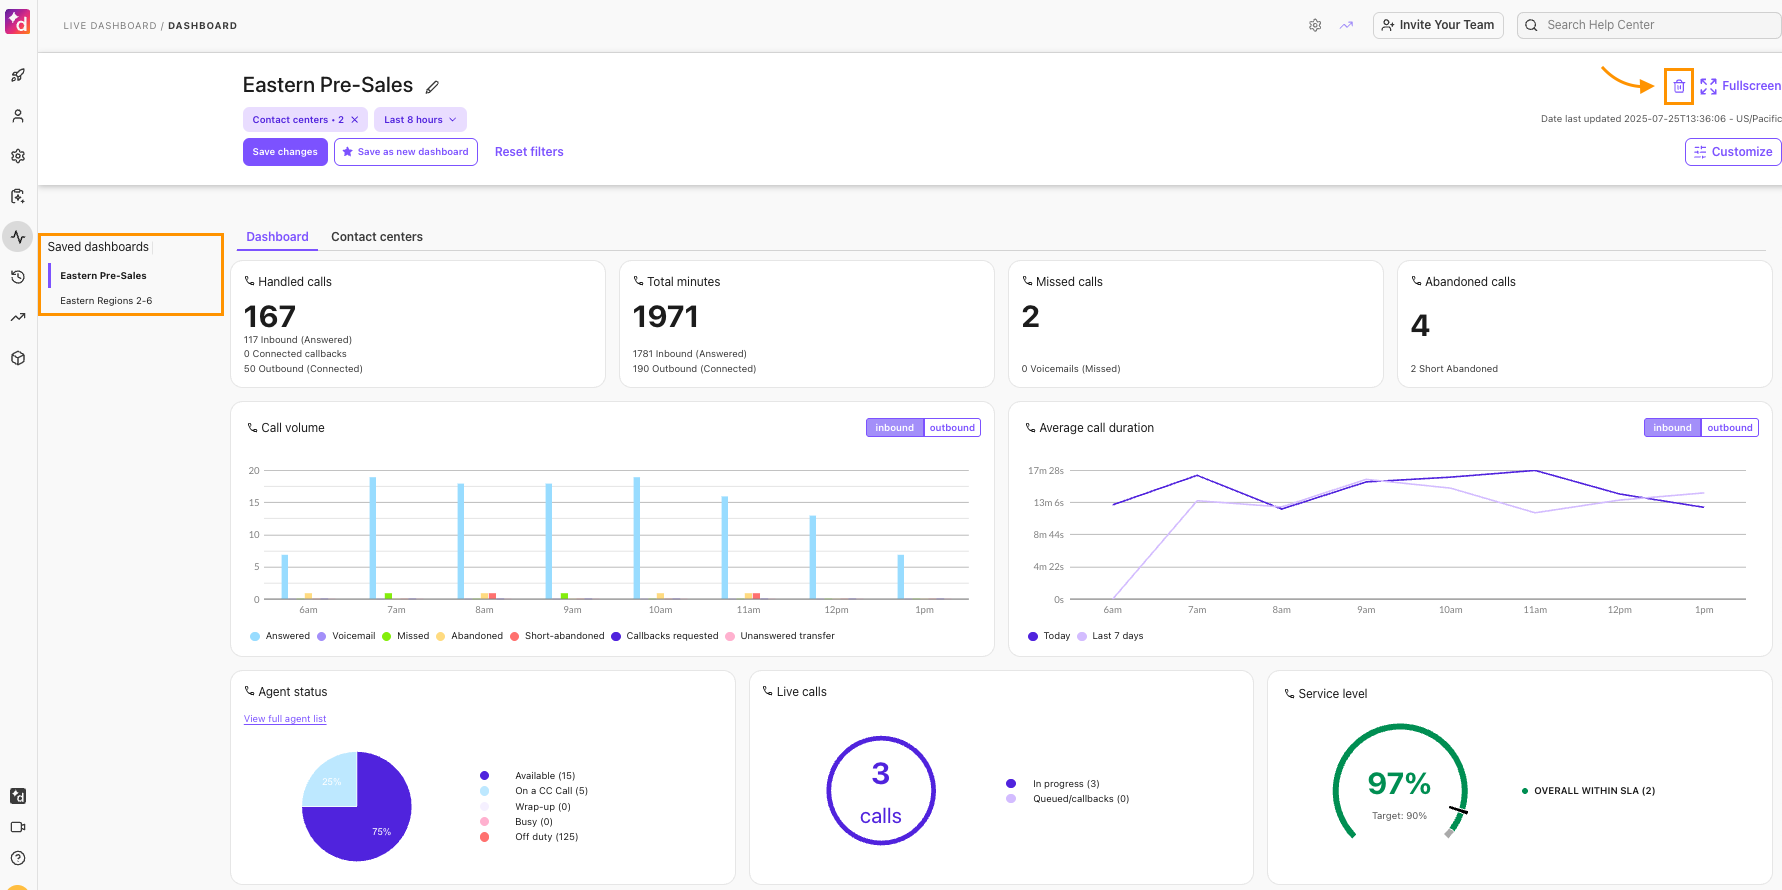
Contact Center alerts
Contact Center alerts appear on your dashboard, allowing you to keep tabs on your high-risk stats in a quick glance. You'll recognize them when cells and/or rows turn red.
