Step into a new era of sales, where AI identifies coaching opportunities, making it easier for managers to provide targeted coaching and support. With historical and real-time data, Dialpad’s Sales Launchpad is your one-stop shop for analytics and insights on sales calls, customer interactions, and team performance metrics.
Not only for coaches, the Sales Launchpad is also available to trainees. With a trainee-specific view, trainees can see their own metrics and rankings among their teammates.
From the Launchpad, coaches and trainees can easily access the Coaching Hub for deeper insights into their teams.
Let’s dive into the details.
Who can use this
Sales Launchpad is available to Coaches and Trainees on a Dialpad Sell plan.
Access Sales Launchpad
To access the Sales Launchpad, you must be a Coaching Team coach or trainee. Company and Office Admins cannot access the Launchpad unless they belong to a coaching team.
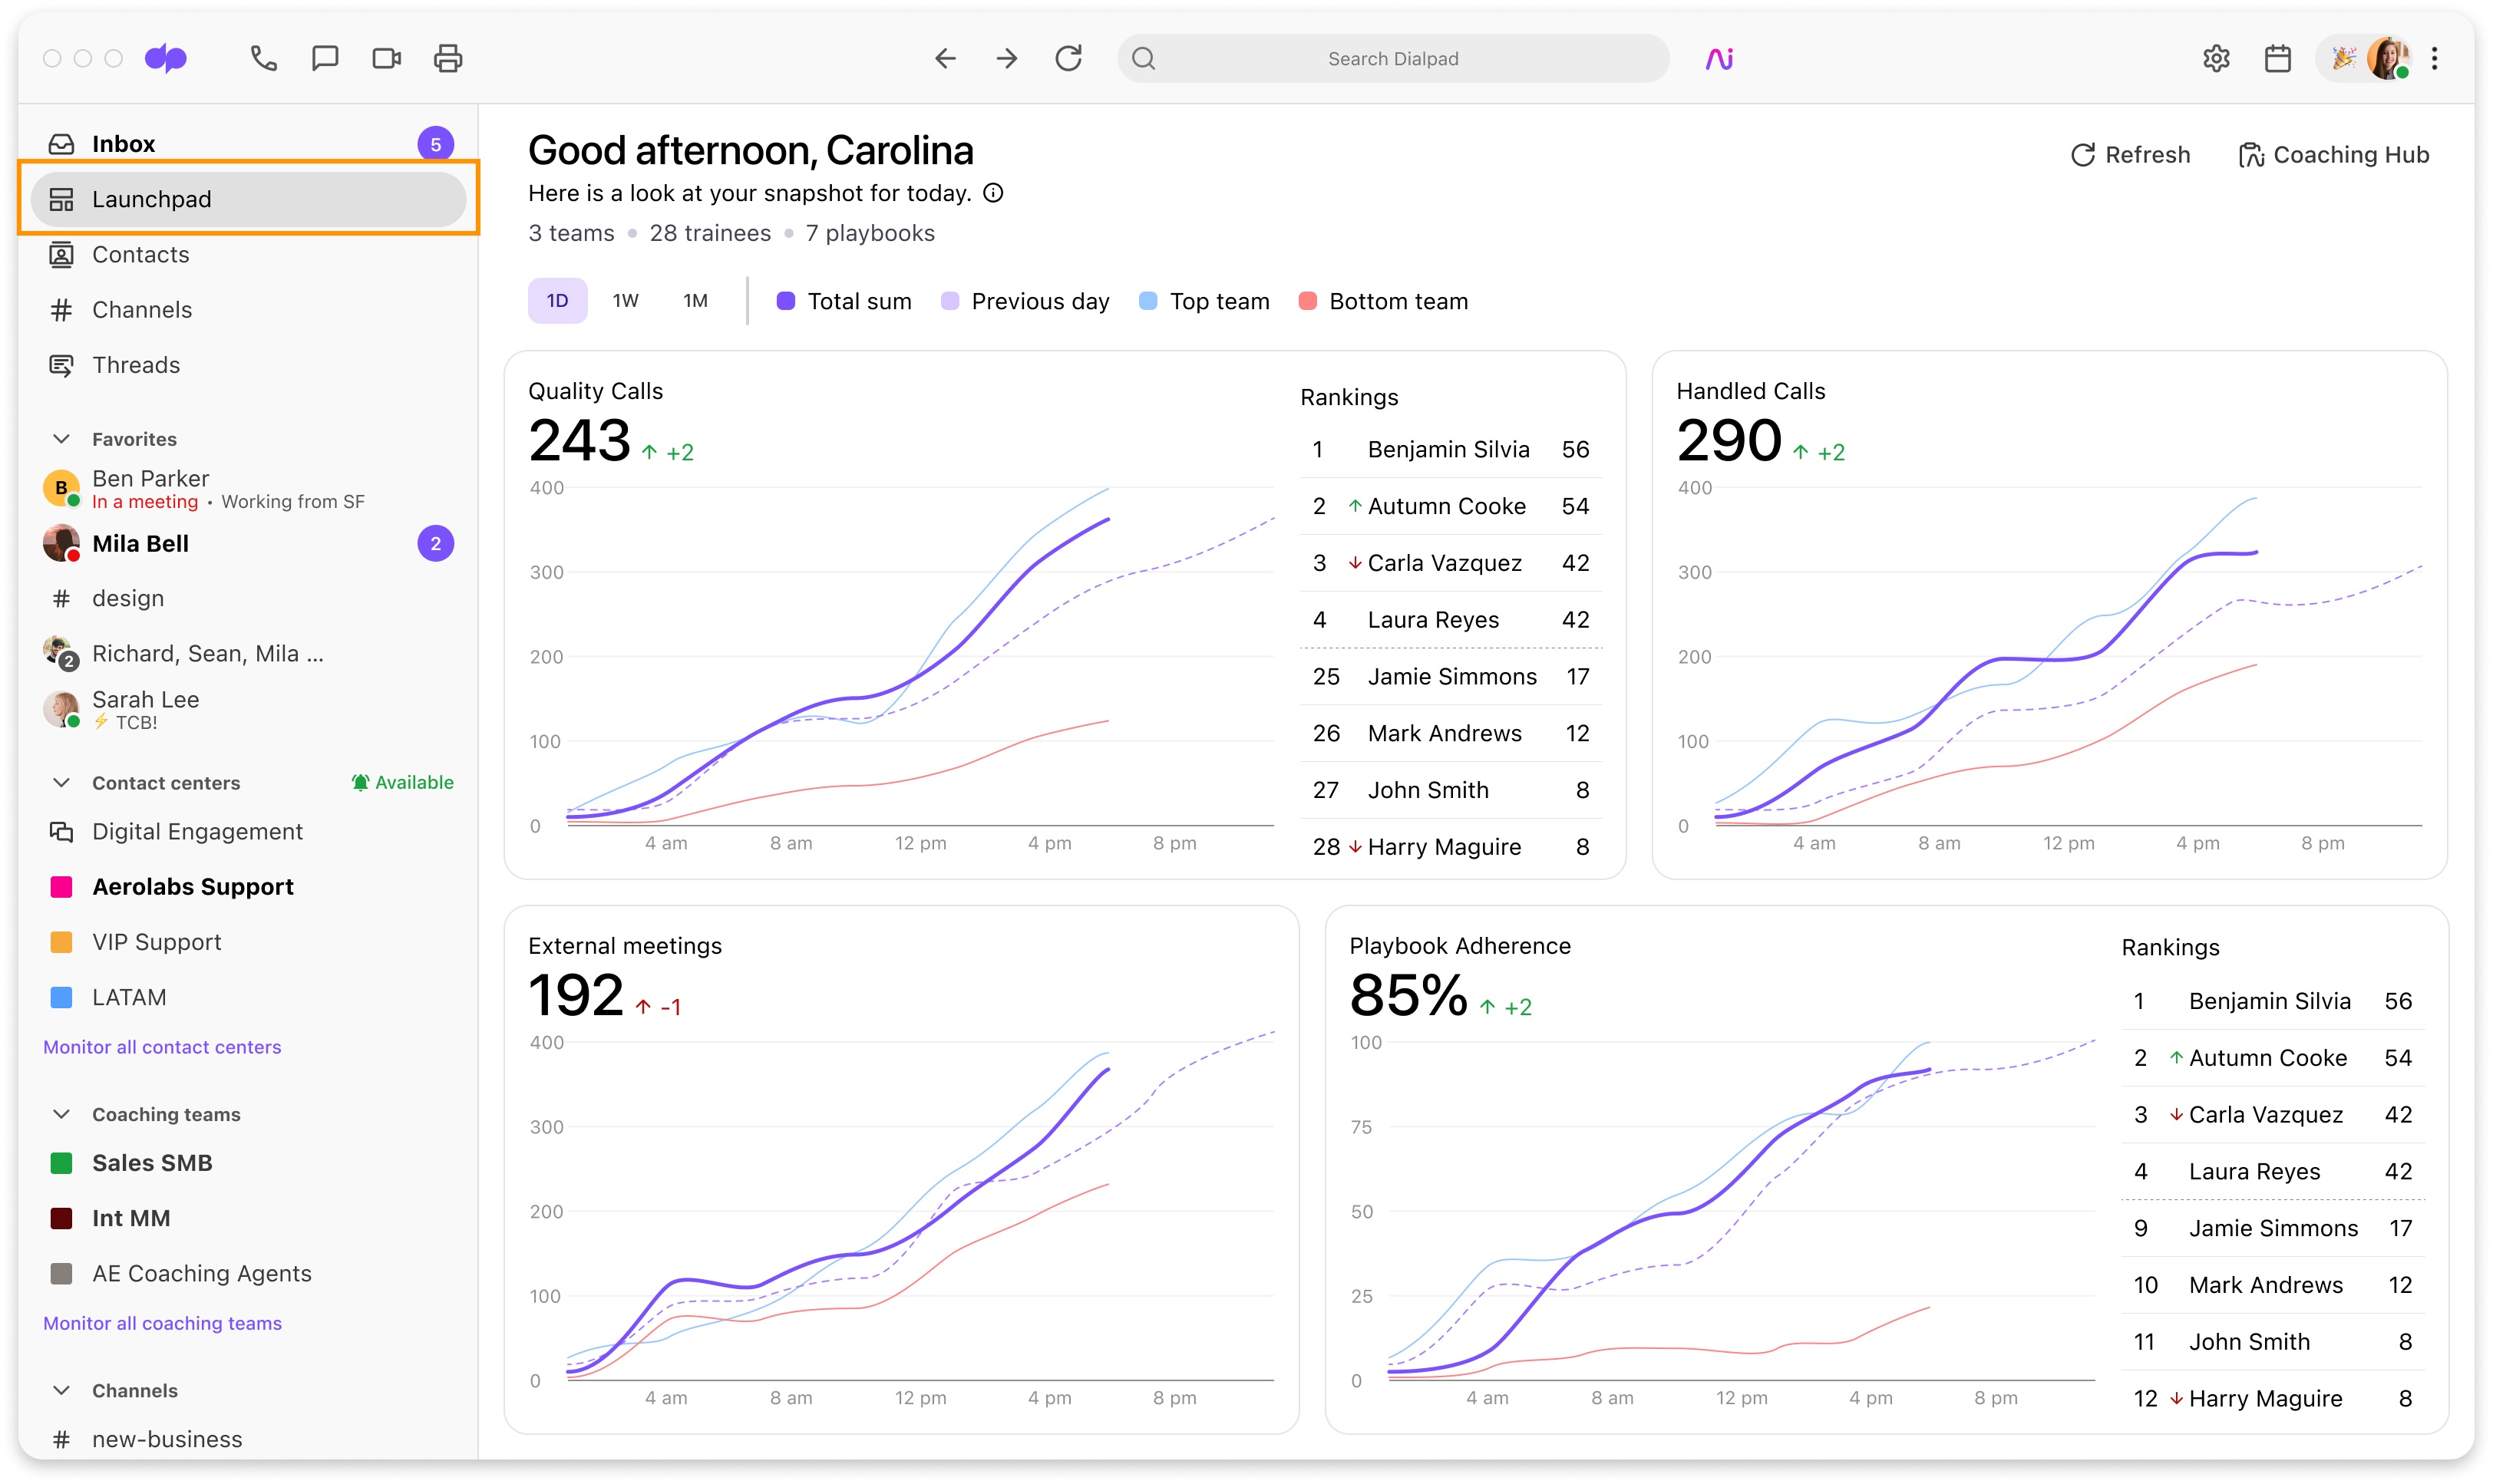
Accessing the Sales Launchpad is easy, simply select Launchpad from the left-hand sidebar of your Dialpad app.
Using the Launchpad
The Sales Launchpad offers two unique views, one for coaches and one for trainees.
While both views offer the same widgets, trainees can only see their own personal metrics, whereas coaches can see metrics for all of their assigned trainees and coaching teams.
Note
If you’re a coach and a trainee, you’ll see the coach view.
No matter the view type, trainees and coaches can filter the date and time, drill into daily scores, and choose to see leaderboards.
Date and time filters
All Launchpad data is shown in the user’s office timezone, with three available date and time choices:
Day (1D): Compares today vs yesterday
Week (1W): Compares this week vs the last week
Weekly comparisons are based on a Monday through Sunday week, not a rolling 7-day period.
Month (1M): Compares this month vs last month
Monthly comparisons are based on a true calendar month, not a rolling 30-day window.
Filter data by day, week, or month by selecting the time filter buttons at the top of the Launchpad. Choose which of the 4 graph data points you want to see by checking and unchecking the box beside their name.
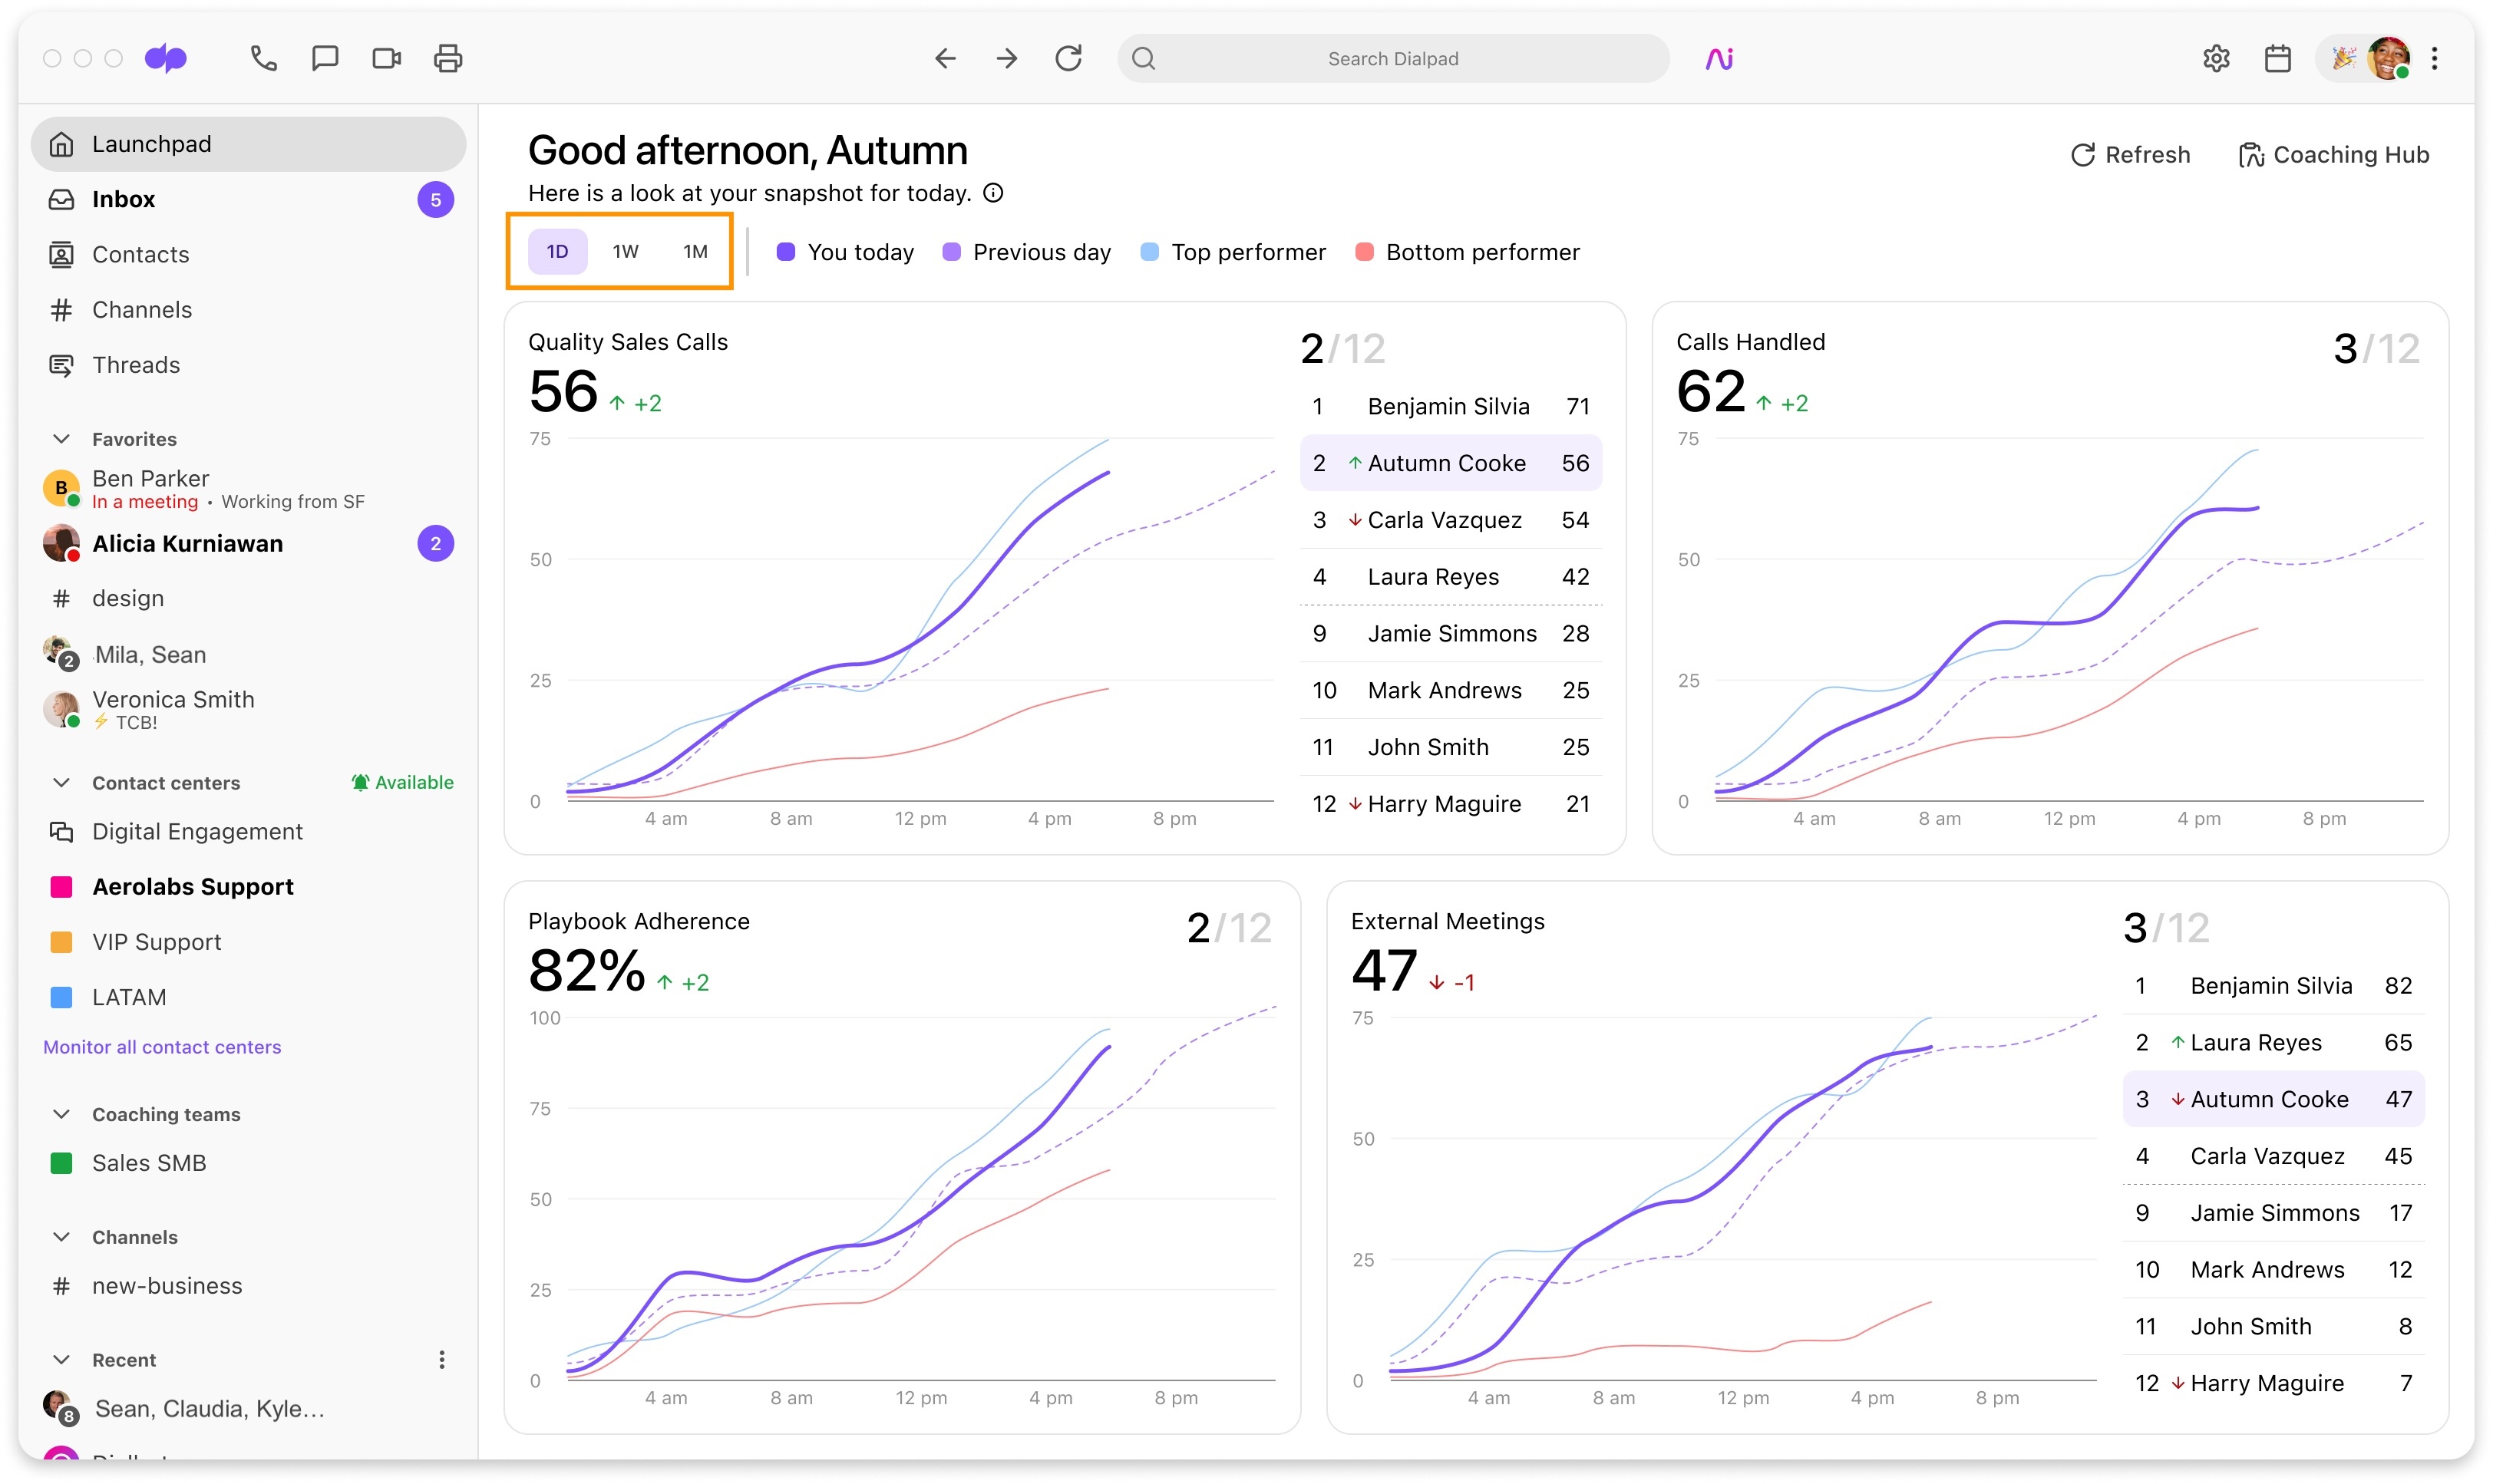
Data is displayed in real-time and refreshes every 2 minutes; to manually update, select Refresh.
Drill into the data
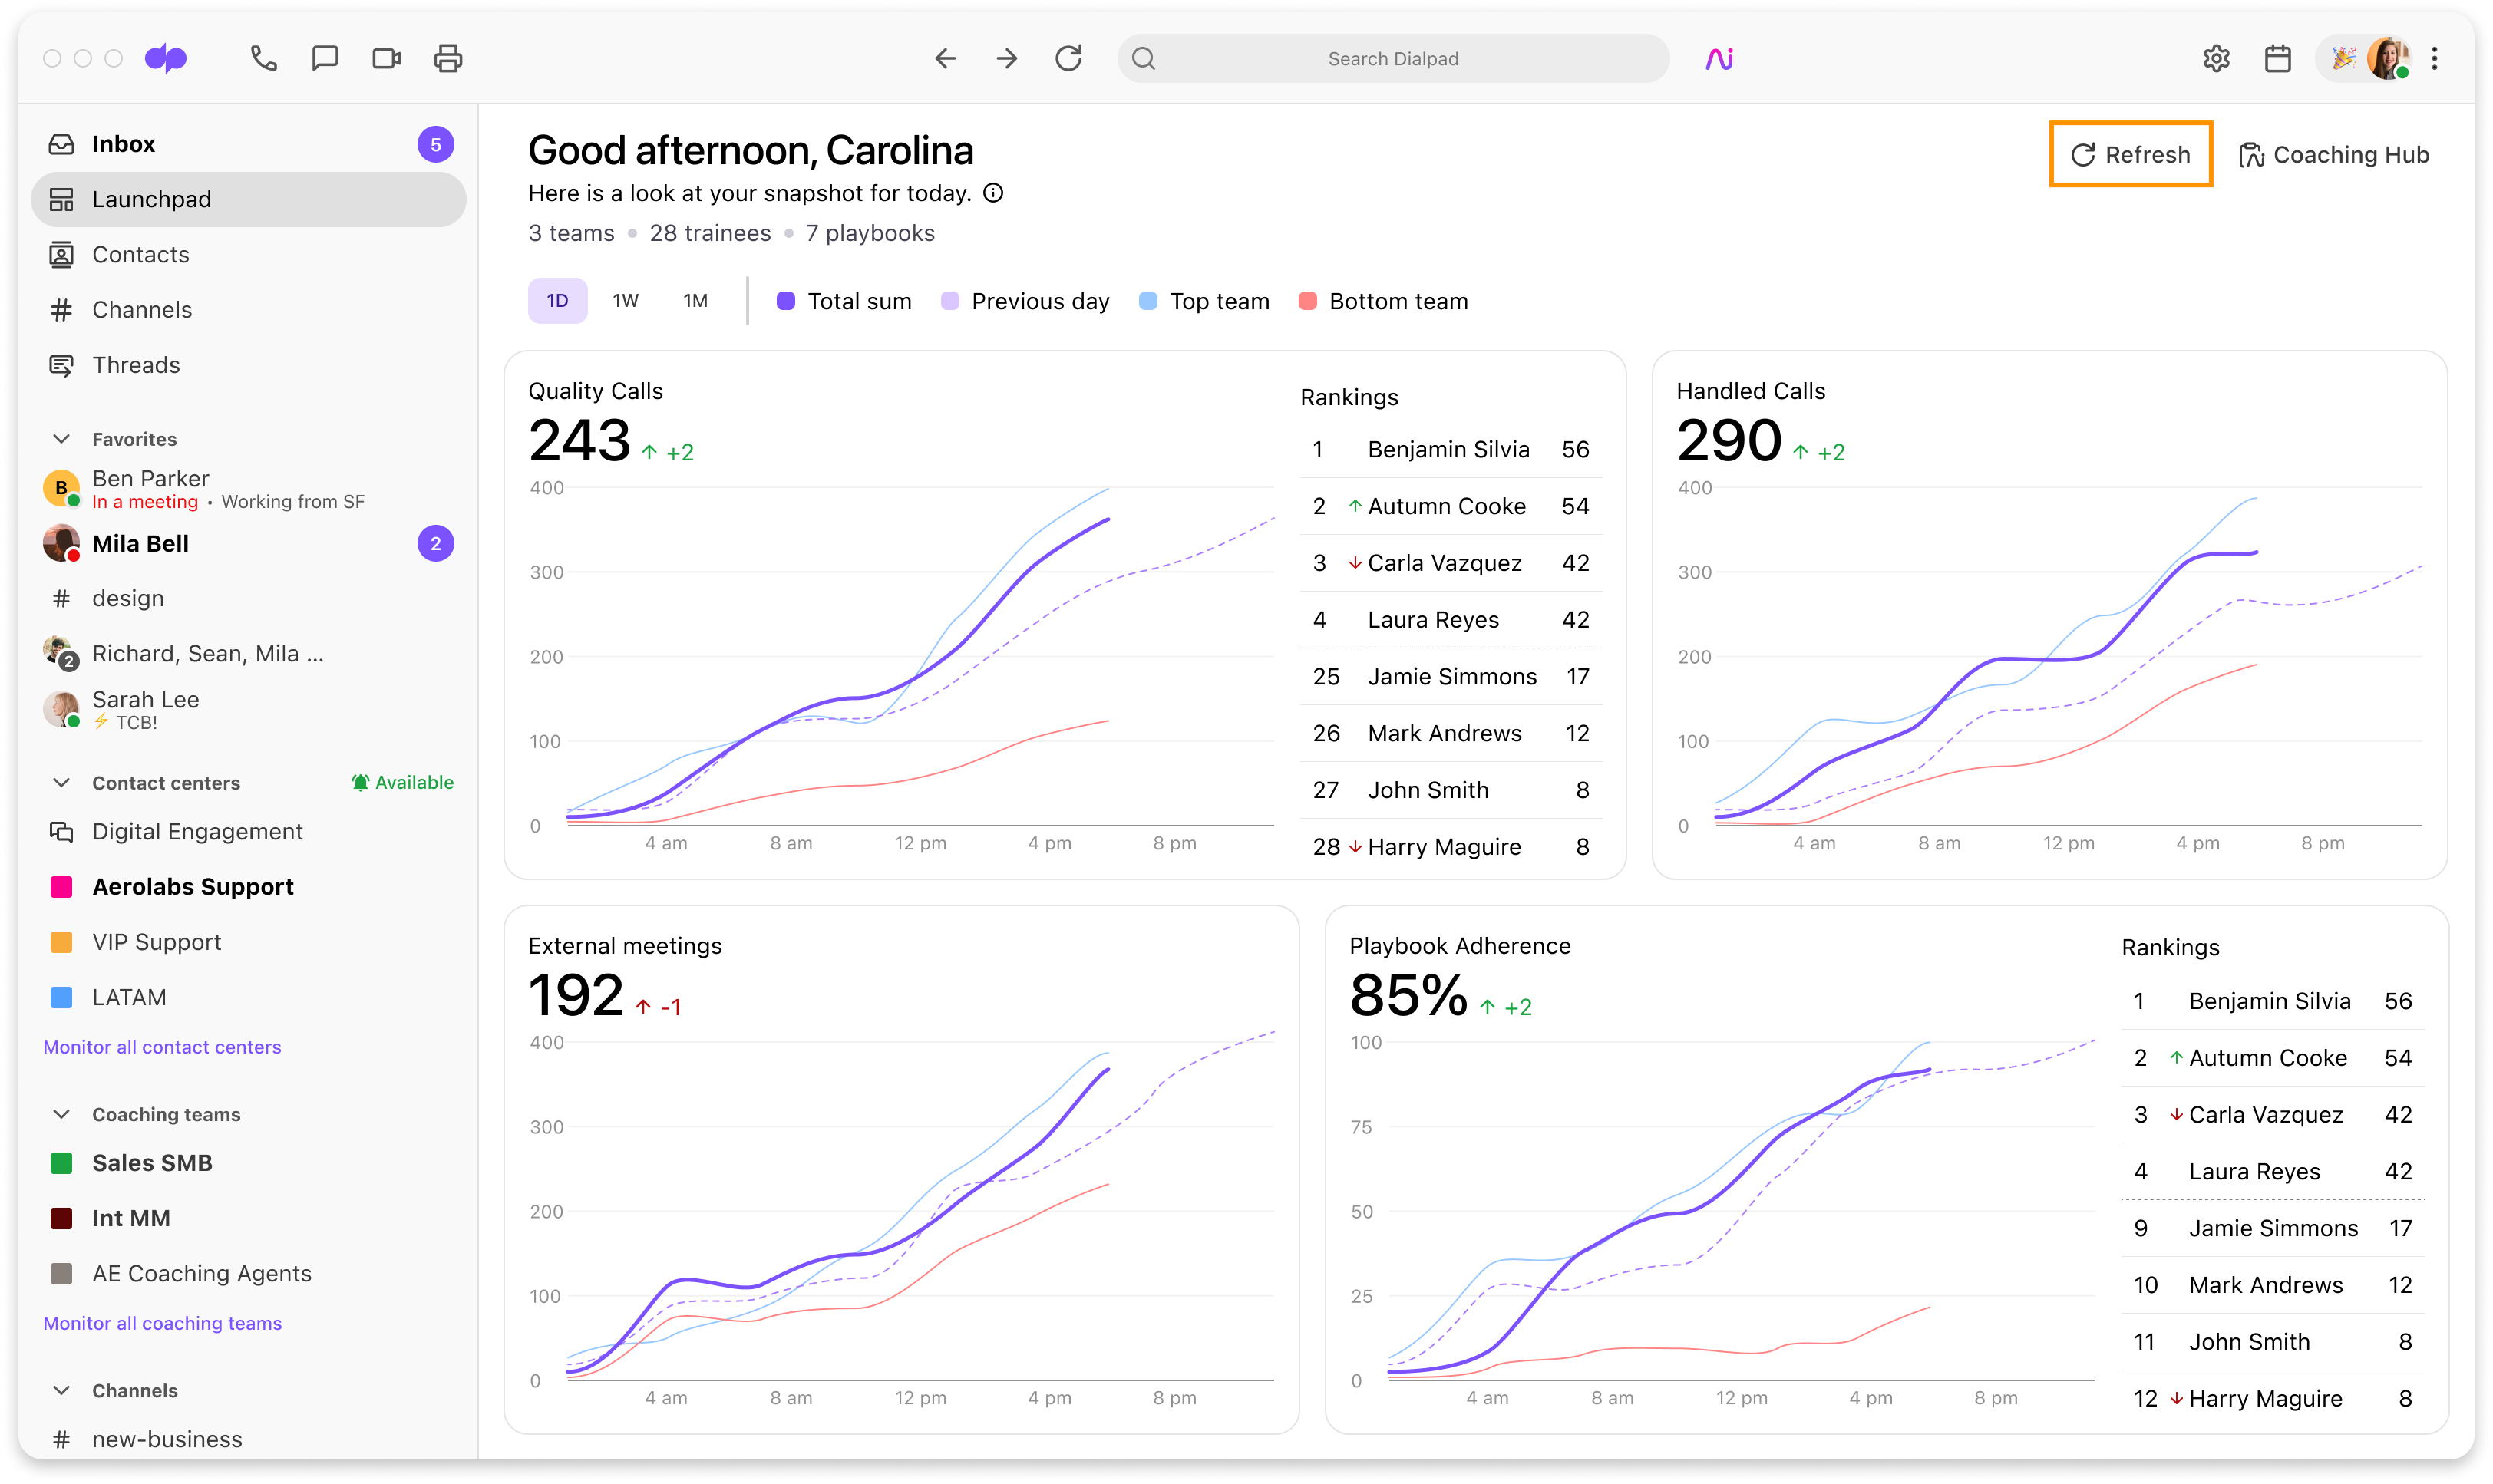
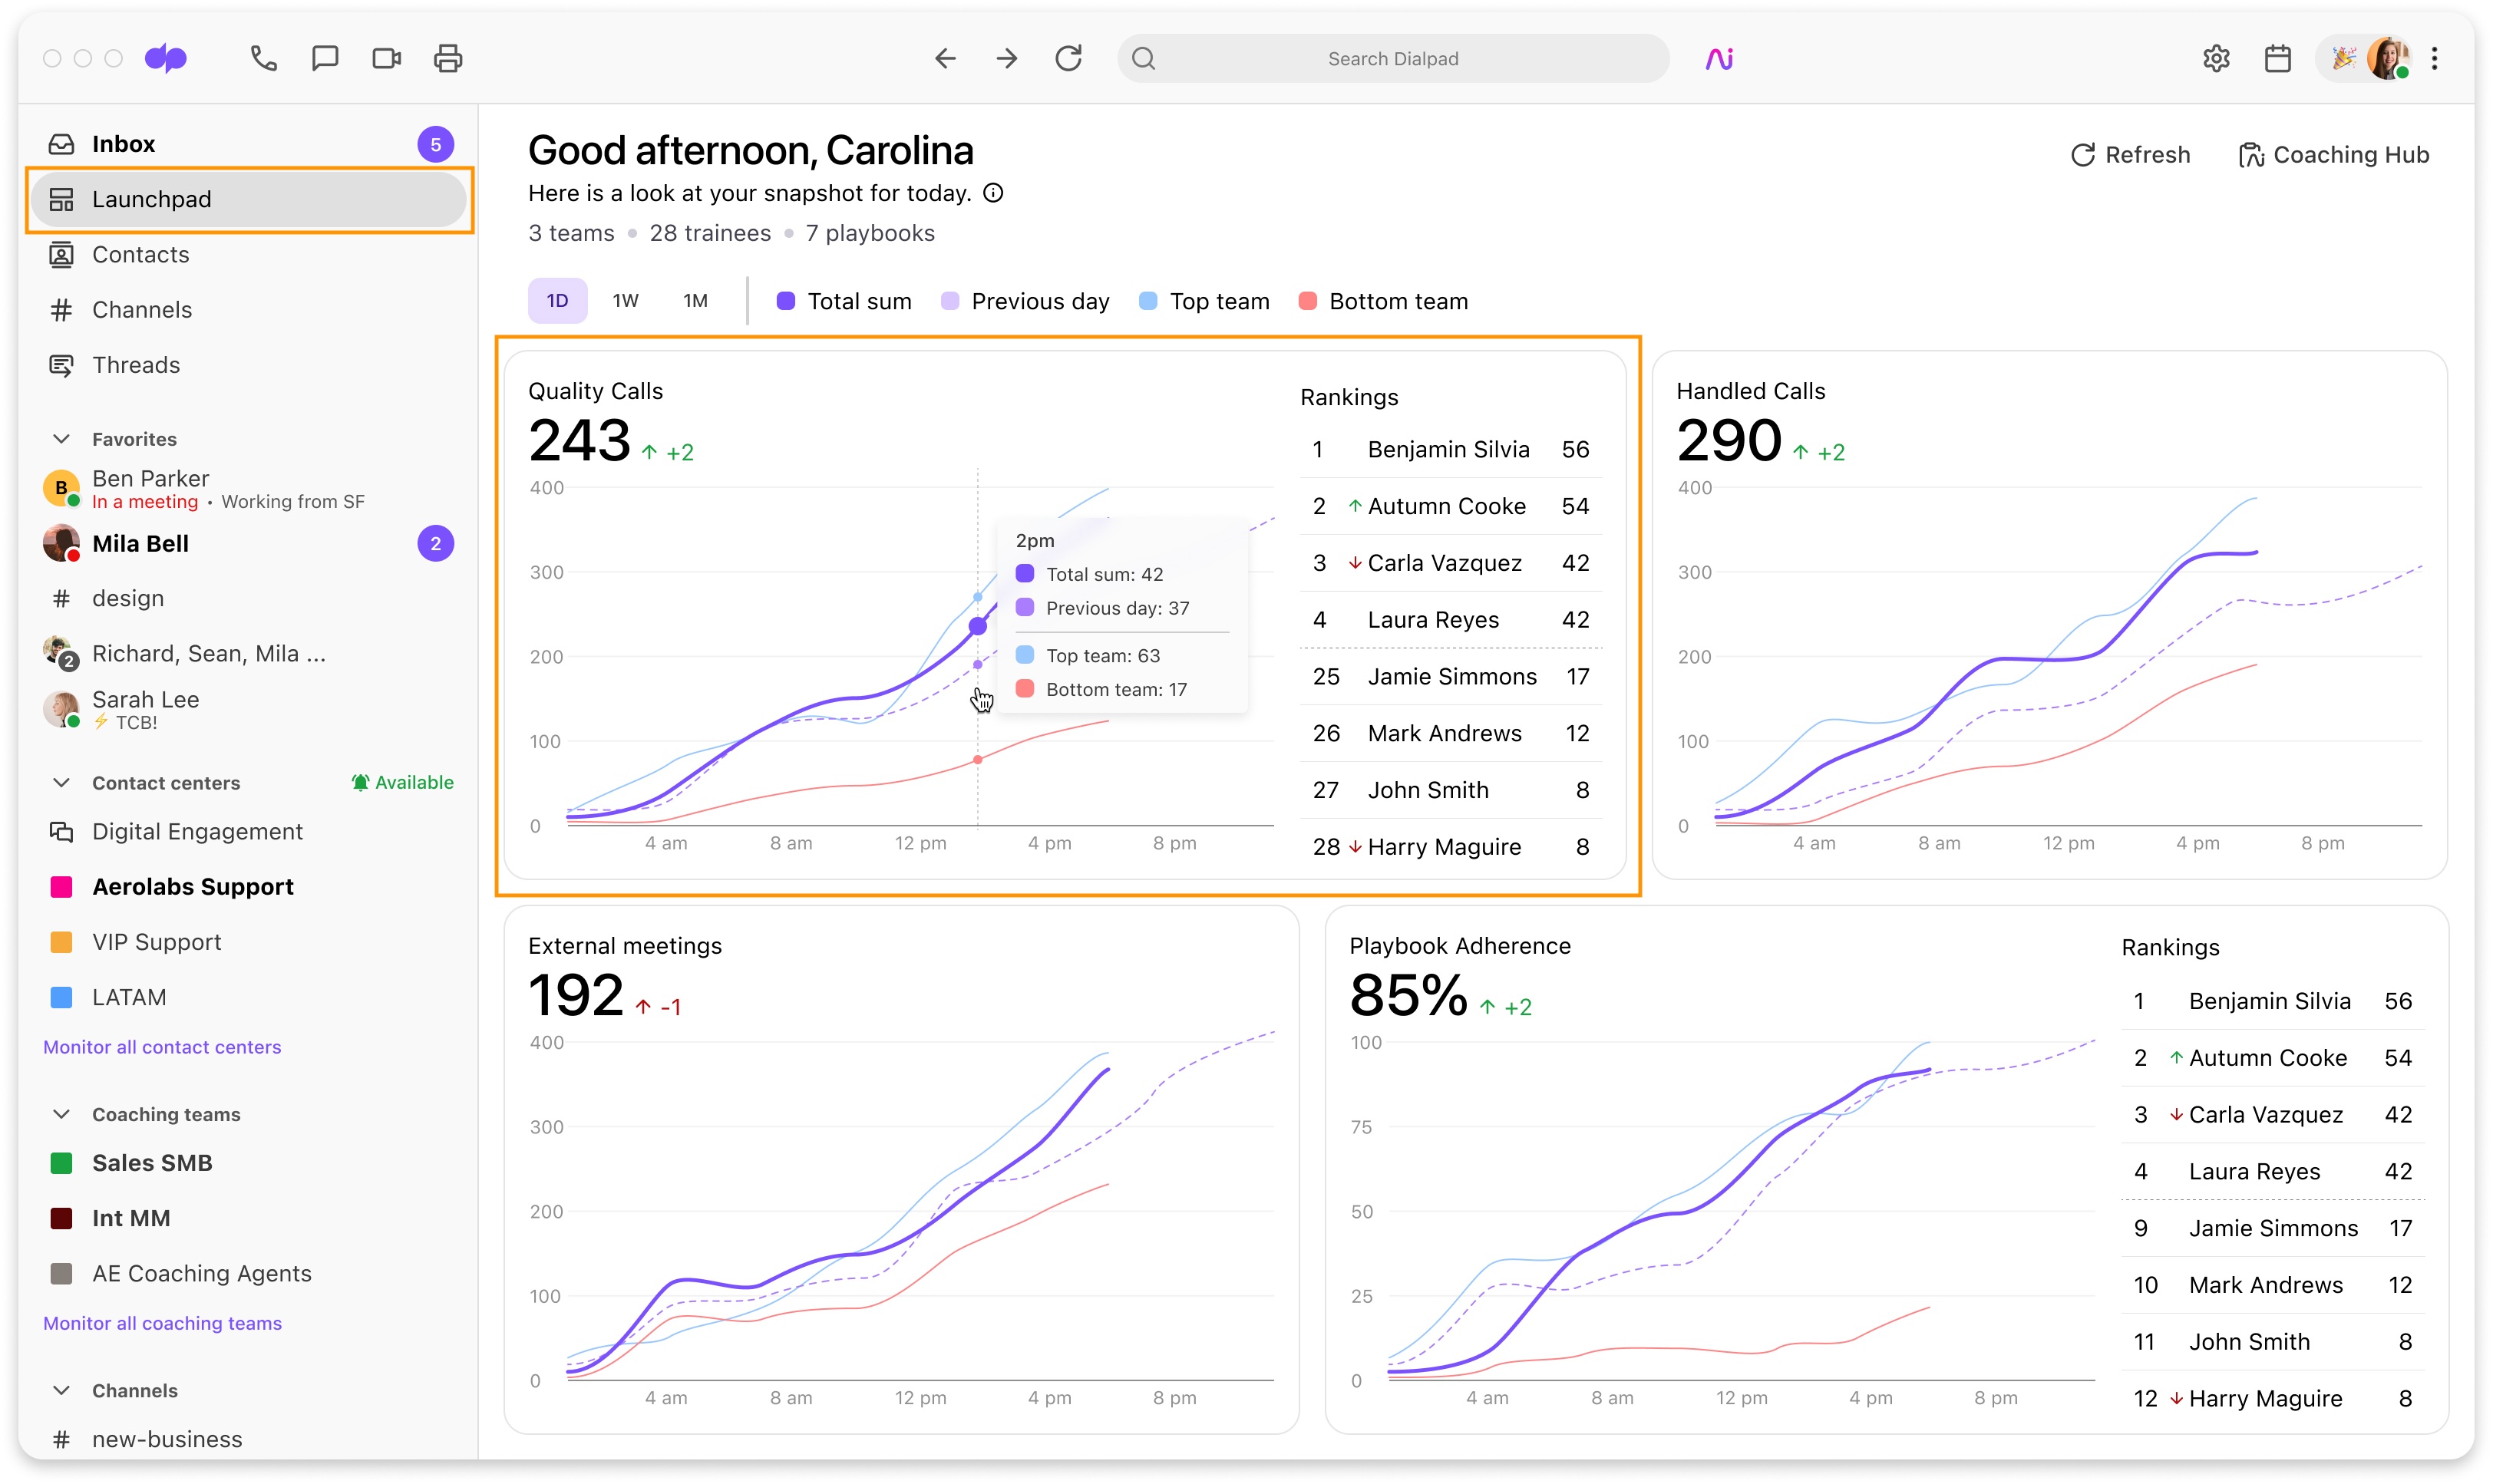
Each widget contains a line graph with four unique lines (data sets).
Hover over any data point to access detailed daily totals and comparisons.
Leaderboards
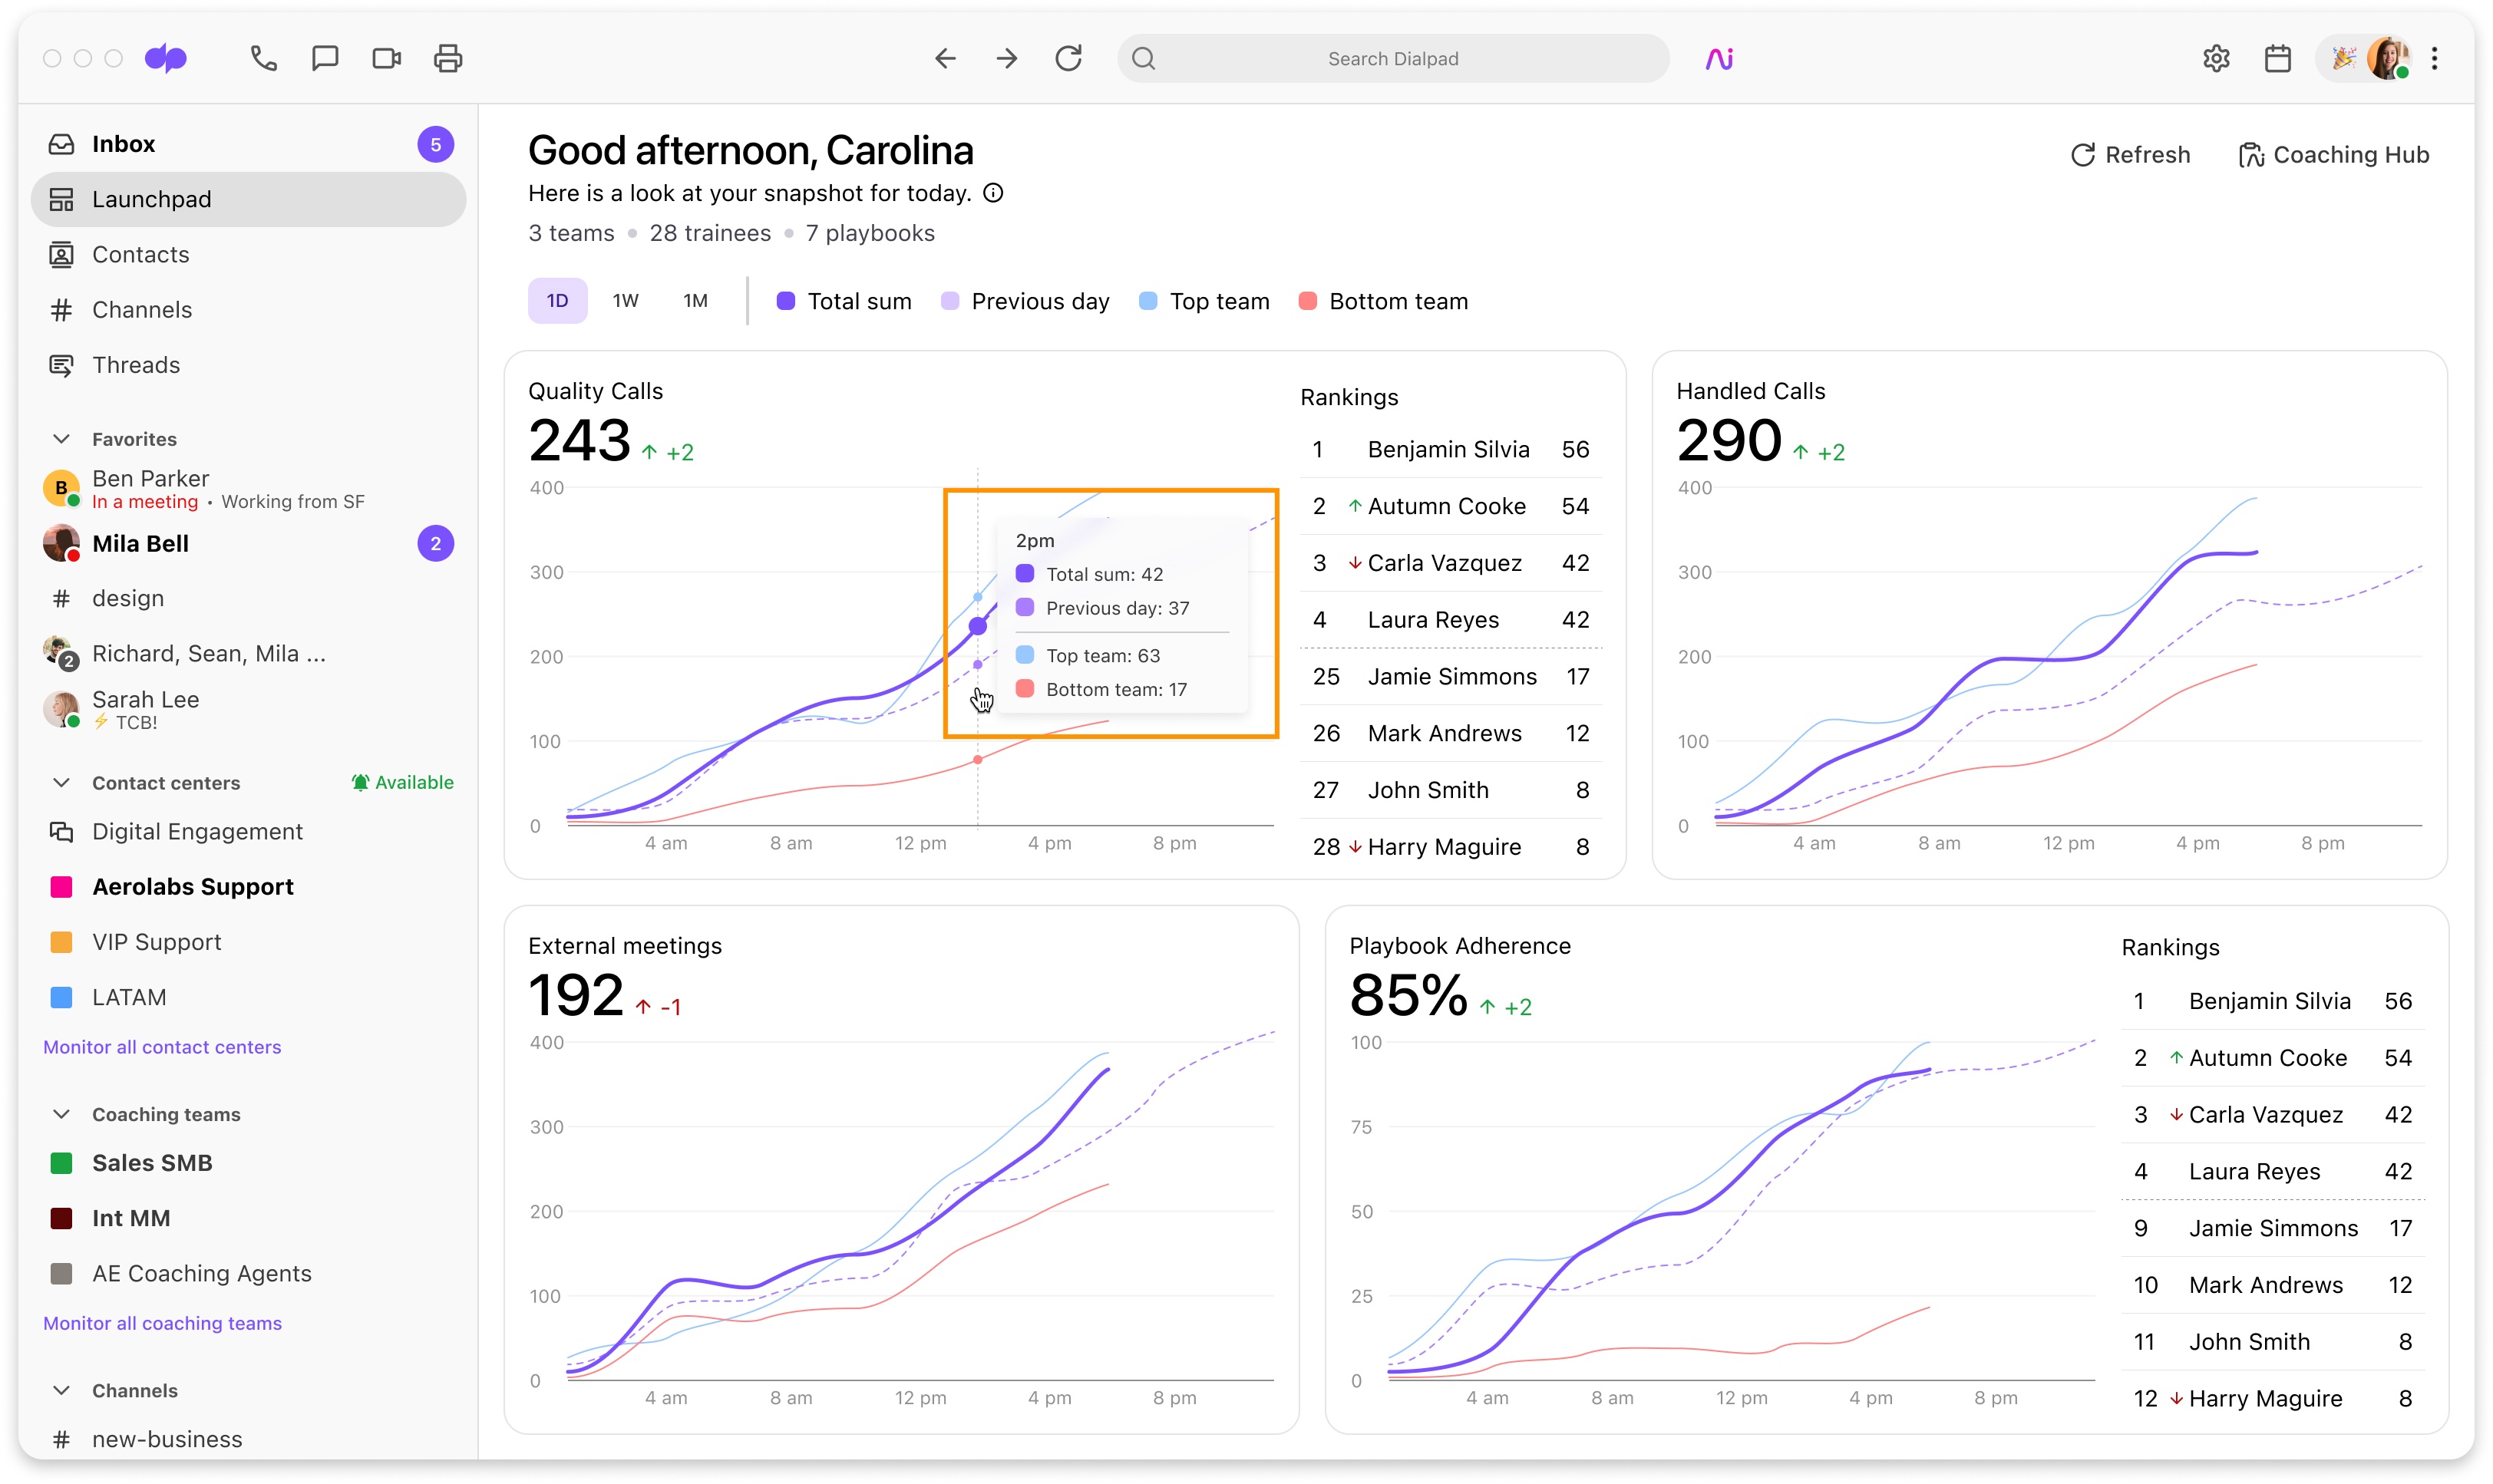
Leaderboards highlight the top 4 and bottom 4 performers in each category.
Coaches will see aggregated data amongst all of their trainees and coaching teams, whereas trainees will only see the names of other trainees within their coaching team.
Not everyone enjoys seeing their ranking, so don't worry, Dialpad lets you hide leaderboard metrics.
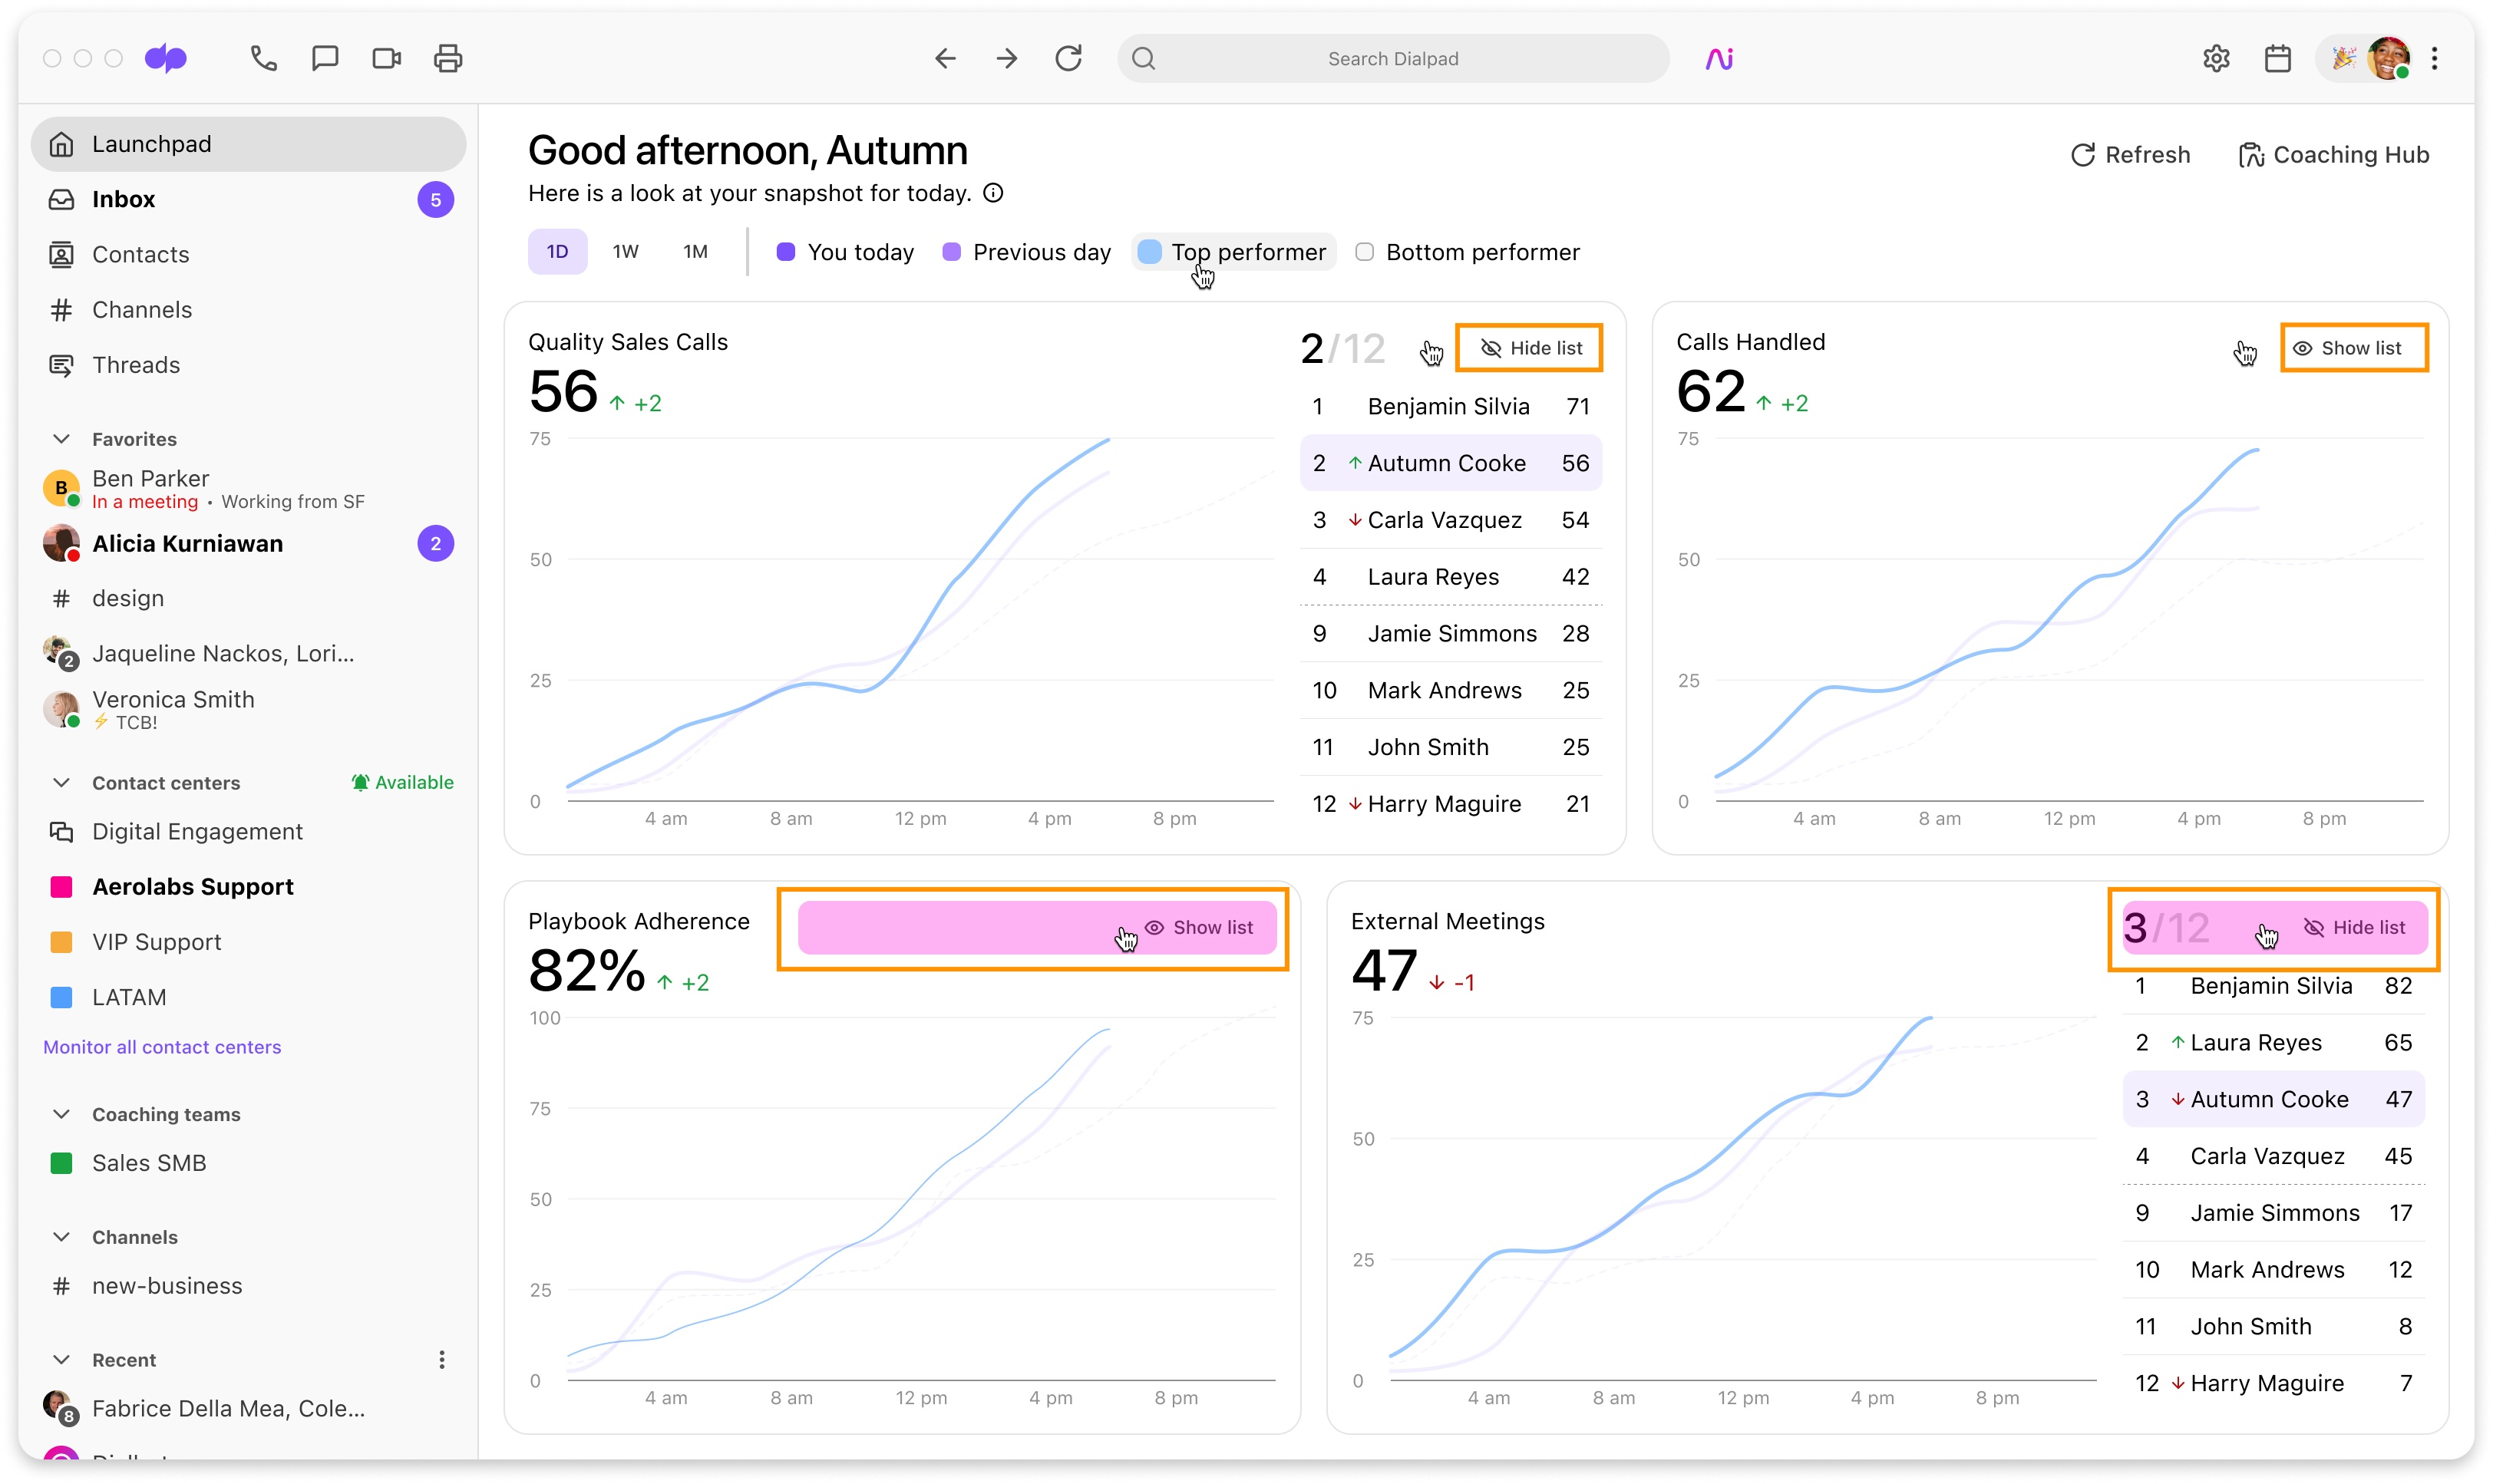
To hide or show a leaderboard, hover over the widget and select Show list or Hide list.
Launchpad widgets
The Sales Launchpad provides four unique widgets to give coaches and trainees actionable and insightful data.
Quality Sales Calls Widget
Handled Calls Widget
External Meetings Widget
Playbook Adherence
Each widget displays different metrics and rankings depending if the viewer is a coach or a trainee.
In a coach’s view, the widgets will display the top 4 and bottom 4 performers across their Coaching Teams.
In a trainee’s view, the widgets display where the trainee ranks amongst their teammates (even if they do not perfectly fit into the top 4 or bottom 4 performers).
Let’s dive into the details of each widget.
Quality Calls Widget
Sales teams make hundreds (perhaps even thousands!) of calls each month. Dialpad Ai analyzes these calls to determine whether they were Quality Calls that should be considered in data insights and coaching.
What is a Quality Call?
A Quality Call lasts longer than one minute and connects to someone outside of your organization. Additionally, Dialpad Ai must detect more than one voice and determine that the conversation was business-related.
The Quality Calls Widget displays the total number of Quality Calls, trainee rankings, and trends.
In the coach view, the widget displays a graph of the aggregate number of Quality Calls across all of their teams or trainees, and the positive or negative change based on the selected time frame. Coaches will also see their top and bottom 4 trainees on the leaderboard.
The trainee view shows the trainee’s total number of Quality Calls and the positive or negative change based on the filtered time frame. The leaderboard shows where the trainee ranks amongst the other team members.
Handled Calls Widget
The Handled Calls Widget displays the total number of calls the trainee or coaching team(s) placed and received within the selected time period.
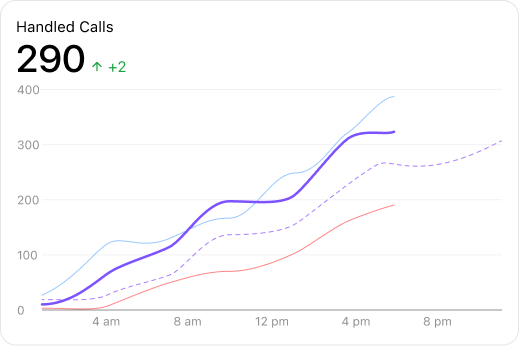
In the coach view, the widget displays a graph of the aggregate number of calls across all of their teams or trainees, and the positive or negative change based on the selected time frame. Coaches will also see their top and bottom 4 trainees on the leaderboard.
The trainee view shows the trainee’s total number of calls and the positive or negative change based on the filtered time frame. The leaderboard shows where the trainee ranks amongst the other team members.
Playbook Adherence Widget
The Playbook Adherence Widget displays the percentage of Ai Playbook adherence in calls, per trainee(s) and coaching team(s).
In the coach view, the widget’s graph displays the average playbook adherence across all their teams or trainees, and the positive or negative change based on the selected time frame. It also provides a trainee leaderboard, letting coaches know which trainees are adhering to the Ai Playbooks that they’re using, and which aren’t.
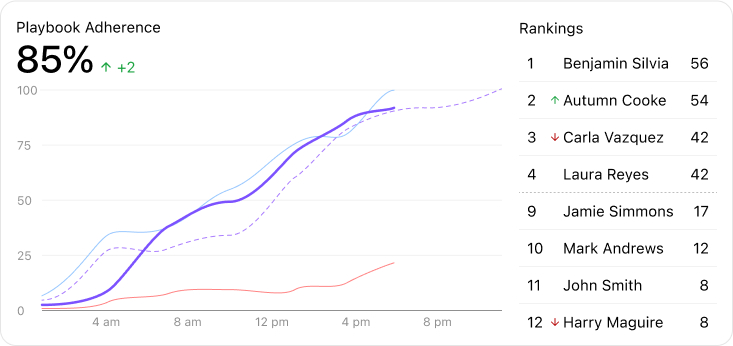
The trainee view shows a graph of the trainee’s average Playbook adherence and the positive or negative change based on the filtered time frame. The leaderboard displays where the trainee ranks amongst the other team members.
External Meetings Widget
The External Meetings Widget displays the total number of external meetings the trainee or the trainees of a coaching team(s) had within the selected time period.
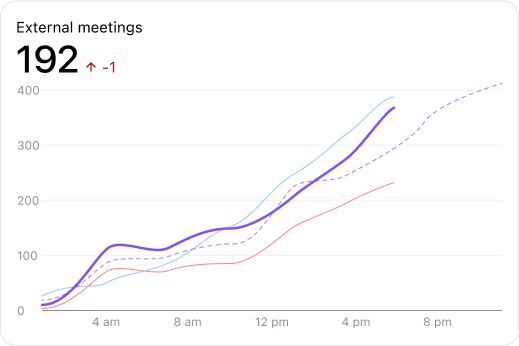
In the coach view, the widget’s graph displays the overall total number of External Meetings across all their teams or trainees, and the positive or negative change based on the selected time frame. It also provides a trainee leaderboard to let coaches know which trainees are having the most (and least) number of External Meetings.
The trainee view shows a graph of the trainee’s total number of external meetings and the positive or negative change based on the filtered time frame. The leaderboard displays where the trainee ranks amongst the other team members.
Note
For a meeting to be included in the trainee’s External Meetings Widget, the trainee must have been the meeting’s host.
Frequently asked questions
What if I am a coach and a trainee?
If you’re a coach in one Coaching Team and a trainee in another, the Coach view of the Launchpad will display by default.
Can I customize the widgets?
Not currently, but this functionality is coming soon, so stay tuned!
Can I filter for different Coaching Teams or trainees?
Not yet, but we’re working on it.
What if I’m not in the top or bottom 4?
If a trainee’s ranking is closer to the top but not in the top four, they will be listed in the top half of the rankings. If they are closer to the bottom, they will appear with their actual ranking number at the top of the bottom four.
Trainees can also see their true ranking in a number format at the top right of every widget. For example, if the trainee is 3rd out of 12 agents, they’ll see 3/12.
Trainees will see their names highlighted for easy reference.
If I’m a coach in more than one Coaching Team, is the average based on each team, or combined amongst all my teams?
If you coach more than one Coaching Team, average scores are aggregated from all of your Coaching Teams.
If you have only one Coaching Team, the average is based on the team average within that team.
Does the Playbooks Widget display adherence for calls and meetings?
No. Currently, the Playbooks Widget shows adherence for calls only. Don’t worry, meeting data will be added soon.