Dialpad's built-in Contact Center Dashboards allow you to monitor metrics, such as ongoing calls, average speed to answer, agent availability, and more. These dashboards provide real-time metrics to help you make real-time decisions and gain real-time insights into your business.
A leaderboard is available that tracks call volume, moments, and sentiment, enabling managers to focus on where agents or reps need help.
Who can use this
Contact Center Dashboards are available to Dialpad Support and Dialpad Sell users.
Contact Center Admins, Supervisors, and Coaches can access the Supervisor Dashboard.
Access Live Contact Center Dashboard
Contact Center Dashboards can be accessed from your Dialpad Admin Settings, or from the Dialpad app.
Access from Admin Settings
To access the Live Contact Center Dashboard from your Dialpad Admin Settings, select the Live Dashboard icon.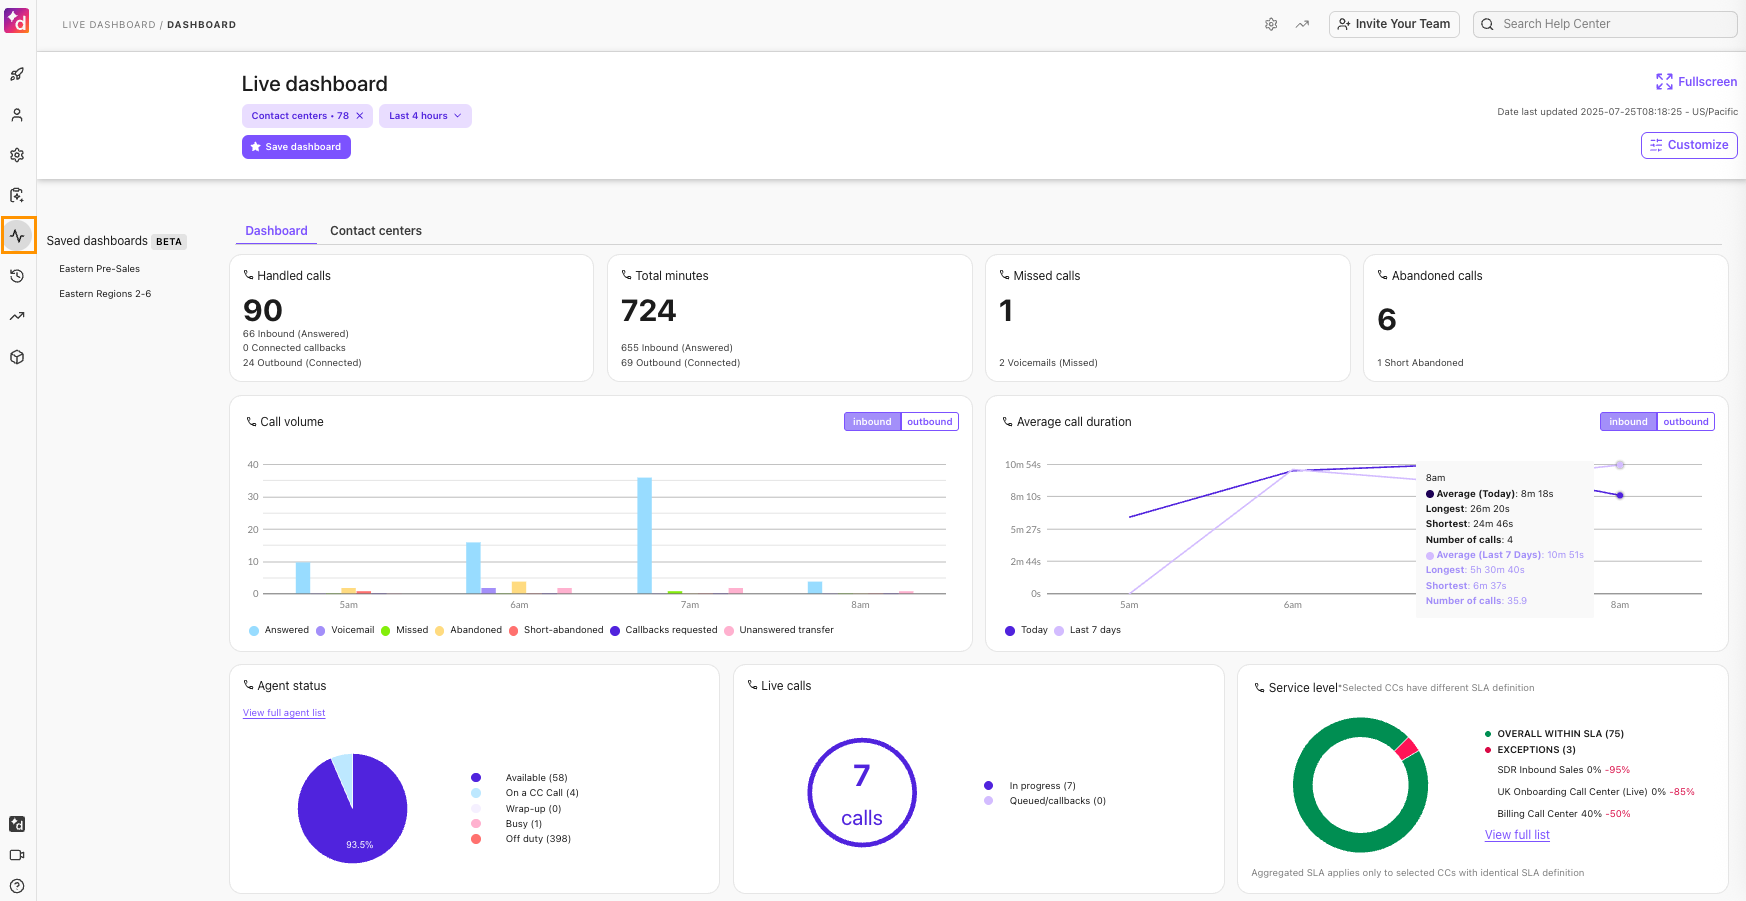
Access from the Dialpad app
To access your Live Contact Center Dashboard from the Dialpad app:
Select Contact Centers and select the desired Contact Center
Select Live Dashboard
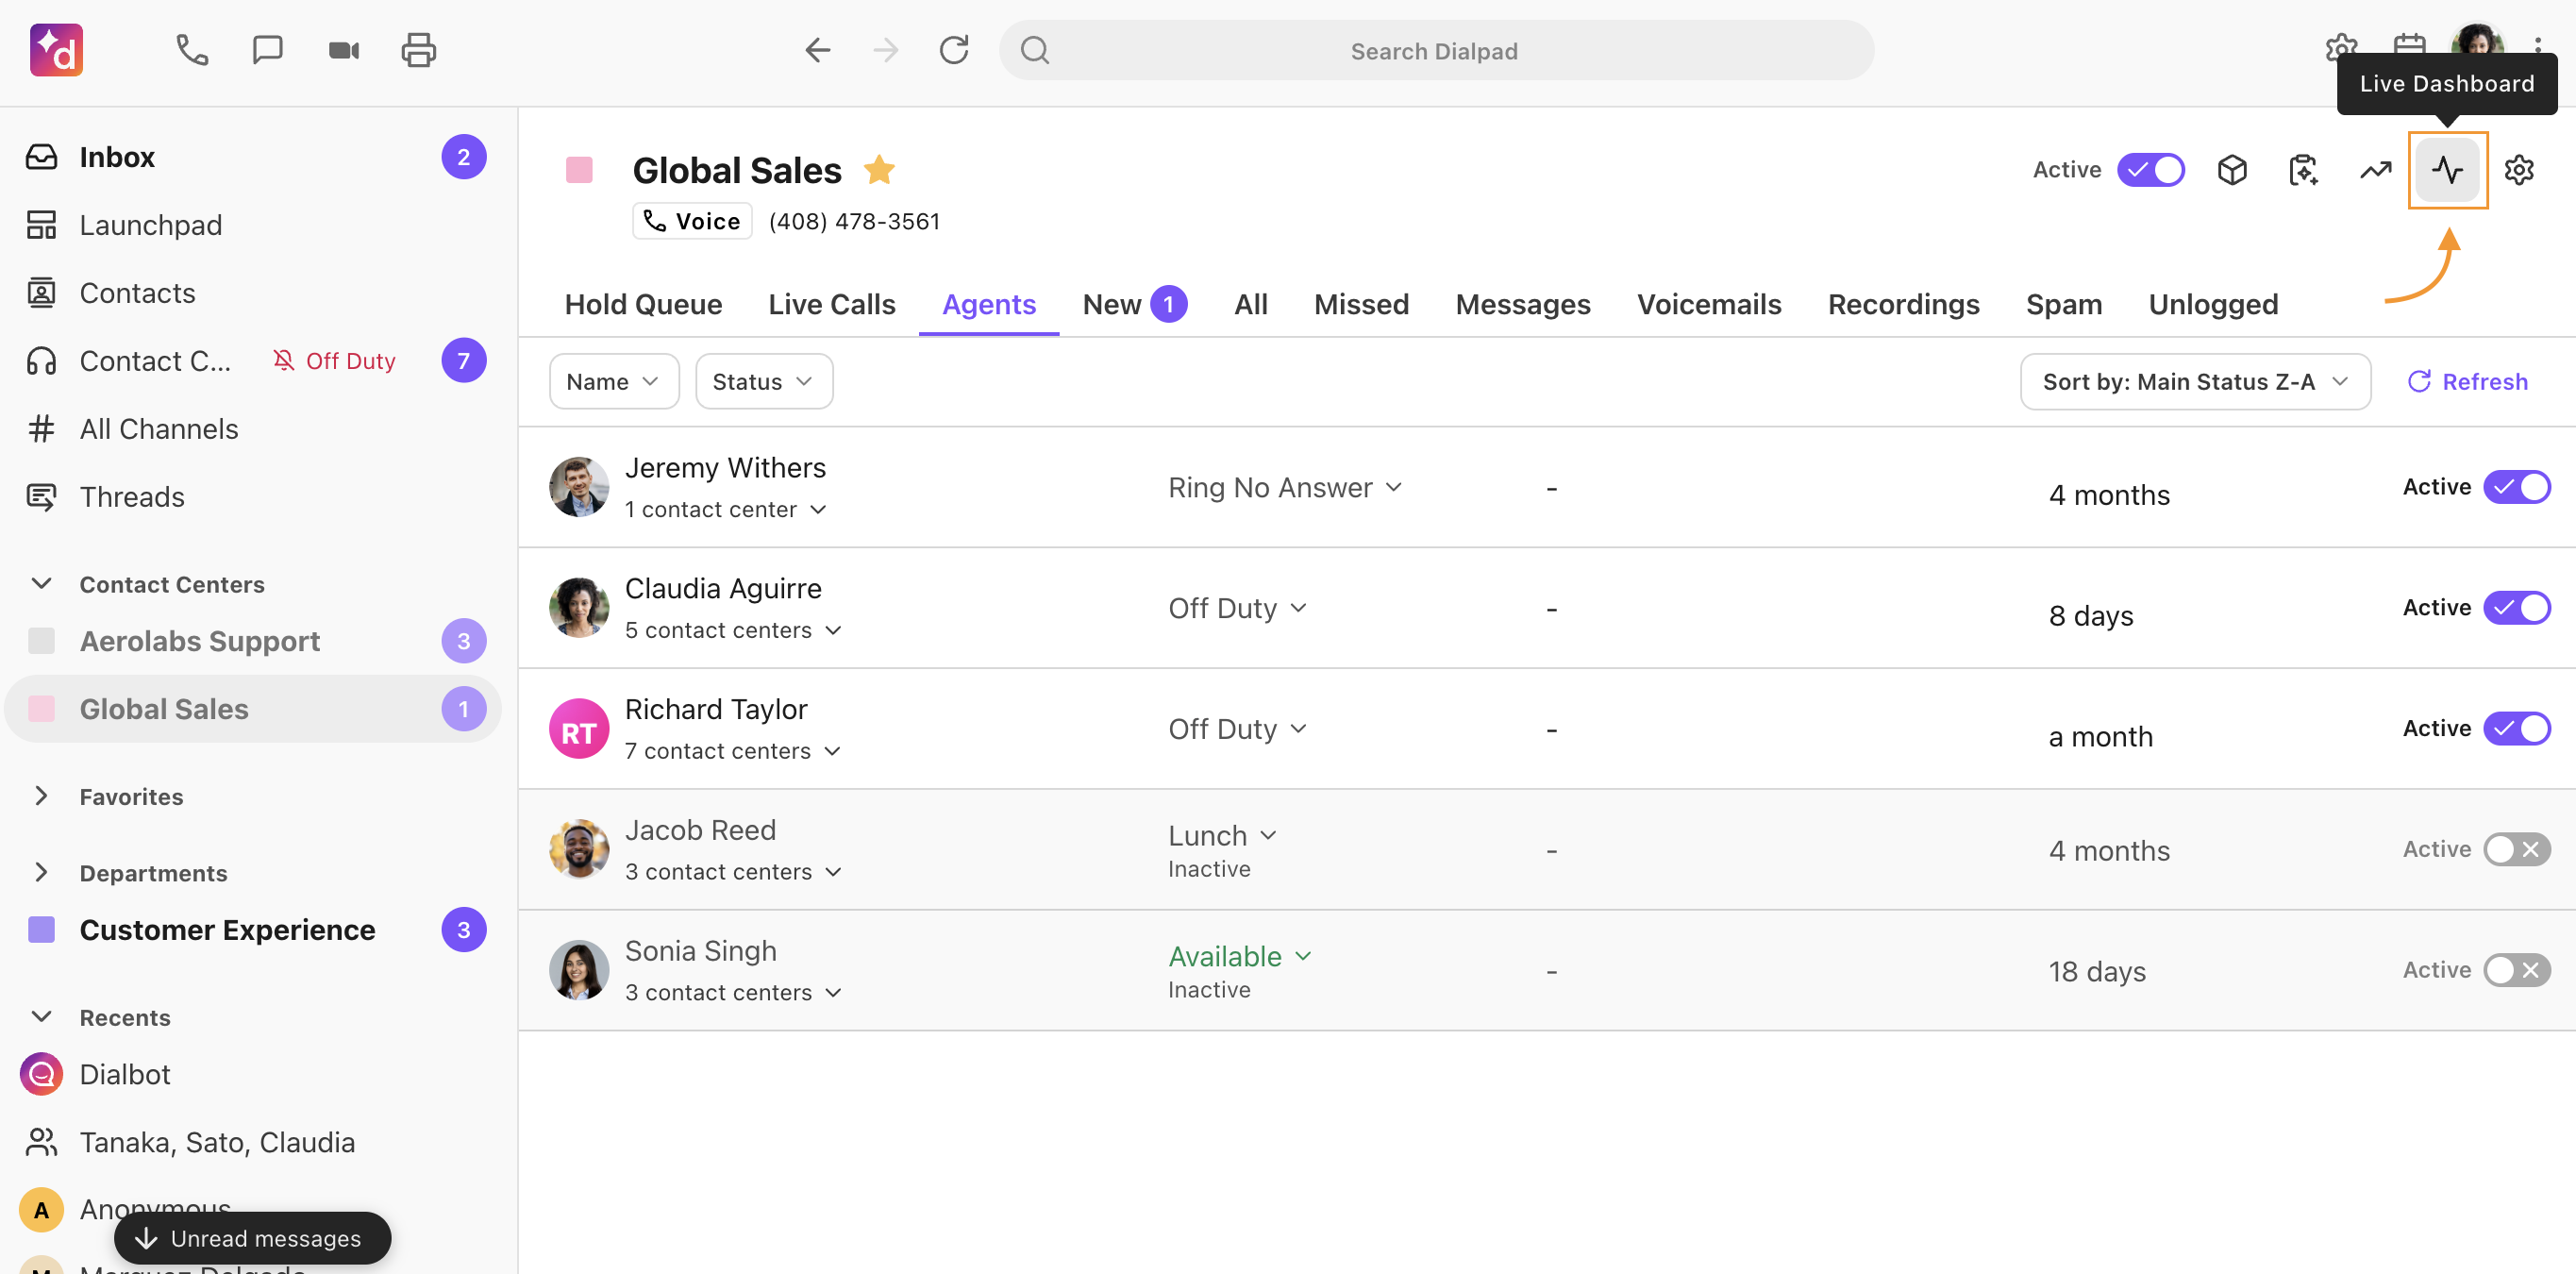
A new browser will open taking you to the Contact Center Dashboard.
Filtering Live Dashboard Data
The Live Dashboard can be filtered by date and specific Contact Center(s).
Both Voice and Digital Contact Centers can be selected. The displayed widgets will dynamically adjust based on the types of Contact Centers chosen. For example, if only Voice Contact Centers are selected, you’ll see widgets relevant to voice interactions. Conversely, if only Digital Contact Centers are selected, the dashboard will show widgets specific to digital channels.
Note
If you are filtering for multiple Contact Centers in the Live Dashboard, the Agent Status details will not populate.
To filter the data, select the Contact Center and Timeframe filters and choose the desired targets.
.png)
Tip
You can customize the widgets and data points displayed, and even rearrange them on the page to suit your preferences.
Learn more here.
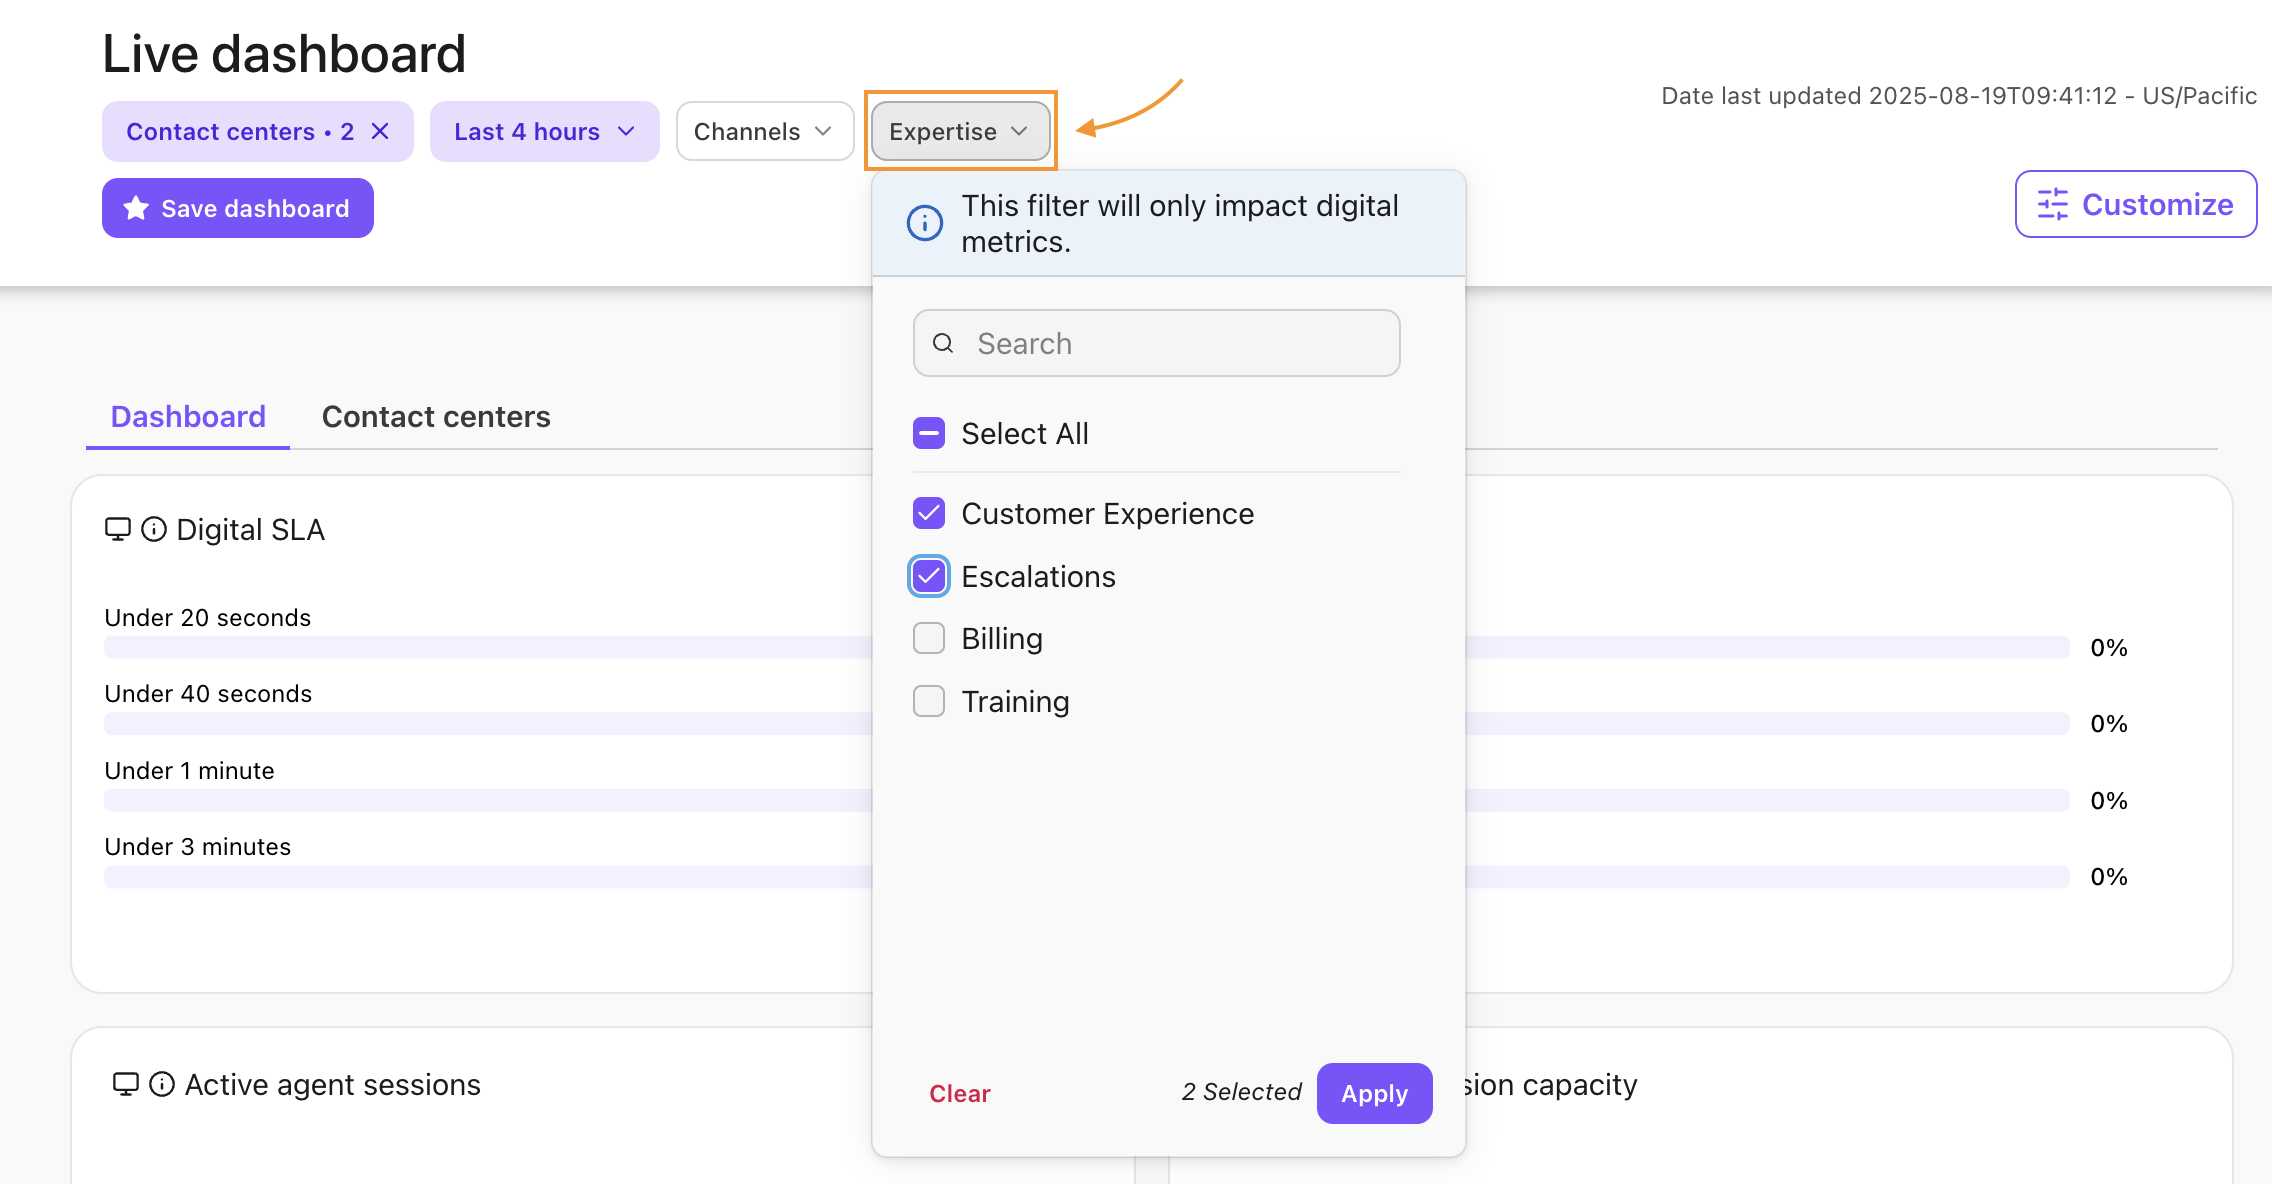
Notes
The Expertise filter lets you select one or multiple expertise areas to filter digital sessions to give supervisors deeper visibility into digital interactions by expertise.
The filter is tied to the selected Digital Contact Center and will only appear when a Digital Contact Center is selected.
If a Digital Contact Center has no skills or expertise configured, the Expertise filter will not display any options.
Live Dashboard Types
Dialpad provides two out-of-the-box live dashboards, a traditional visual dashboard, and a high-level leaderboard that lets you spot key data at a glance.
Dashboard
An easy-to-read visual summary of your Contact Center's health and performance. Quickly review large, visual representations of your calls, call volume, average call duration, channel activity, SLA, Agent-to-Caller Ratio, speed to answer, agent status, session capacity, survey engagement, survey CSAT score, and so much more.
.png)
Contact Centers
A table meant for monitoring multiple Contact Centers at a glance, giving you insights into key live metrics. 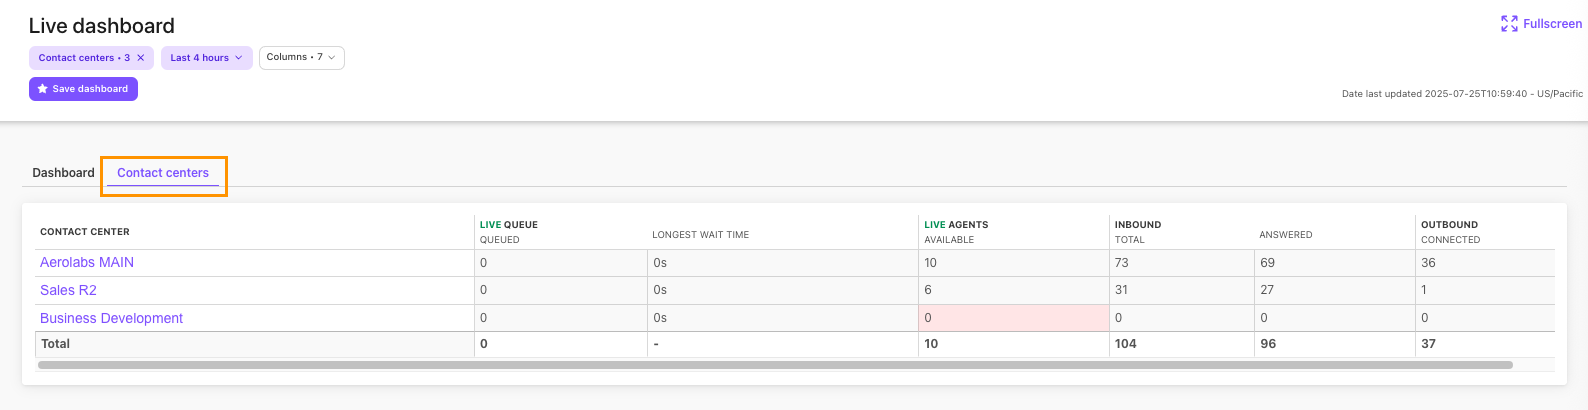
Dashboard metrics
Let’s take a look at the different widgets and data points you see on your Live Dashboard.
Tip
Hovering over data within a widget reveals a more precise view of performance.
Call overview metrics
The call overview widgets give you insights into call volume, call duration, live calls, and more. .png)
Here, you’ll find the following data points:
Handled Calls | All of the Inbound, Outbound, and Connected Calls. This total includes any calls that are live calls. |
Total minutes (in minutes) | The total number of inbound and outbound calls, presented in minutes. |
Missed Calls | The number of missed calls and missed calls that were sent to voicemail |
Abandoned Calls | The number of abandoned calls, as well as short abandoned calls. This includes calls received during closed hours and excludes calls that left a message. |
Call Volume | The call volume noted by hour and call type. The visuals for inbound and outbound calls are separate. |
Average Call Duration | The average call duration per day, and compared to the last 7 days. The visuals for inbound and outbound calls are separate. |
Tip
Select a call volume metric to open the Call History menu, filtered for that specific set of calls.
Agent status, live calls, & service level
Review the Agent Status widget, along with the Live Calls and Service Level metrics, to gain deeper insight into your contact center's busiest times.

Here, you’ll find the following data points:
Agent Status | This provides a live view of the total number of agents assigned to the Contact Center and their statuses. |
Live Calls | This displays the number of calls in progress and queued. |
Service Level | This displays the percentage of calls answered during the Contact Center's open hours, within the time threshold set for that Contact Center (default is 60 seconds). Short Abandoned Calls are excludeded as the difference between the moment the call arrives ('date_started') and when it connects to an Agent ('date_connected') |
Hold queue metrics
Hold Queue Metrics provide insight into your staffing needs. These metrics include Speed to Answer, Abandon Rate, and Agent: caller ratios.

Here, you’ll find the following data points:
Speed to Answer | This displays the shortest, longest and average amount of time it takes your agents to answer a call. |
Abandon Rate | This displays the percentage of calls that are Abandoned by the caller before reaching your agents. It is further broken down into the shortest, longest, and average amount of time the caller waited before hanging up. |
Agent:Callers | This displays the average ratio of agents to callers, as well as the number of callers currently in your queue, helping identify the current handling capacity (or lack thereof) for your Contact Center. Agents included are those available to take calls, on a call, or in wrap up time for the given Contact Center specifically. Callers included are those currently on a call, or in the hold queue for the given Contact Center. |
Session Metrics
Session Metrics provide insight into your digital channels, letting you know how many agents are actively chatting, how busy your channels are, and more. 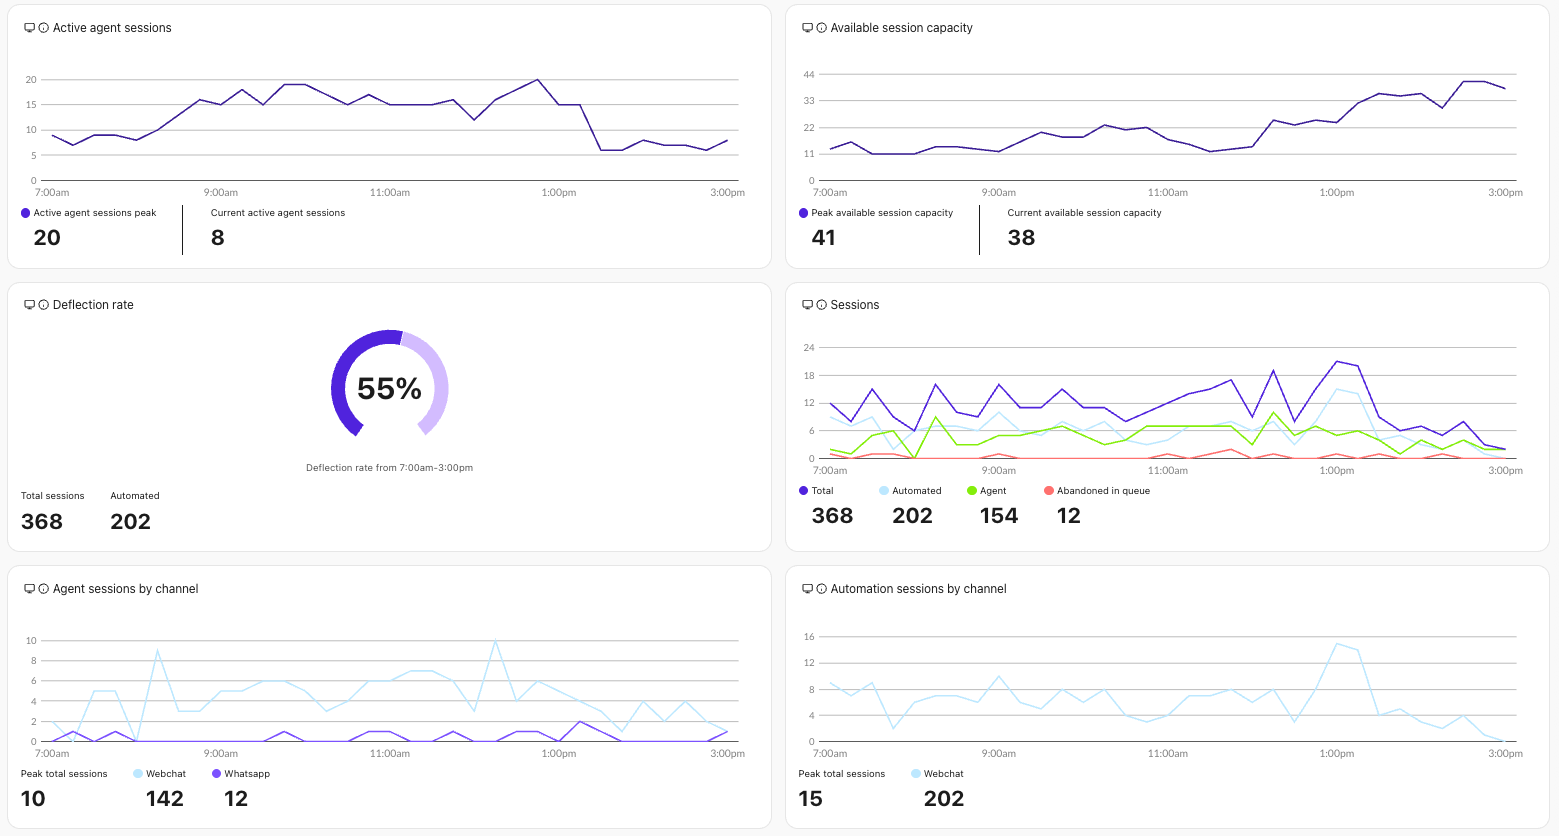
Here, you’ll find the following data points:
Active Agent Sessions | Displays how many agents are actively engaged with a customer on a digital channel. |
Available Session Capacity | Displays the number of open sessions available across all agents. |
Deflection Rate | Displays the total percentage of sessions that were automated and never connected to an agent. |
Sessions | Displays an overview of your sessions. You’ll see the total session count and totals for each type of session. |
Agent sessions by channel | Displays the number of agent sessions on each of the selected channels. *The large numbers at the bottom display the totals for each channel type. |
Automation sessions by channel | Displays the total automation per channel. *The large numbers at the bottom display the totals for each channel type |
Survey metrics
Survey metrics provide insight into both the number of customers completing your CSTA survey and the scores they’re giving.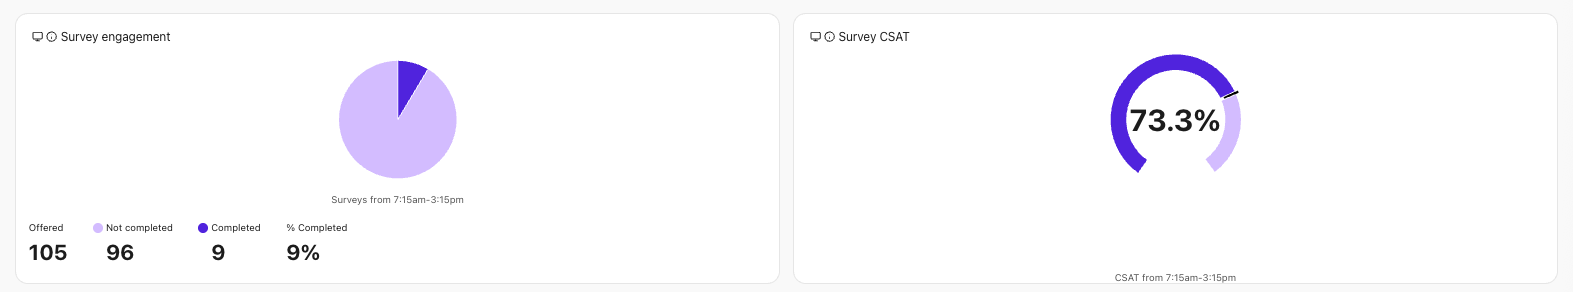
Here, you’ll find the following data points:
Survey engagement | This displays how many customers have, or haven’t, completed your CSAT survey. |
Survey CSAT | Displays the average CSAT survey score over the selected time range. |
Ai Agent metrics
AI Agent metrics provide insight into how well your AI Agent is performing.
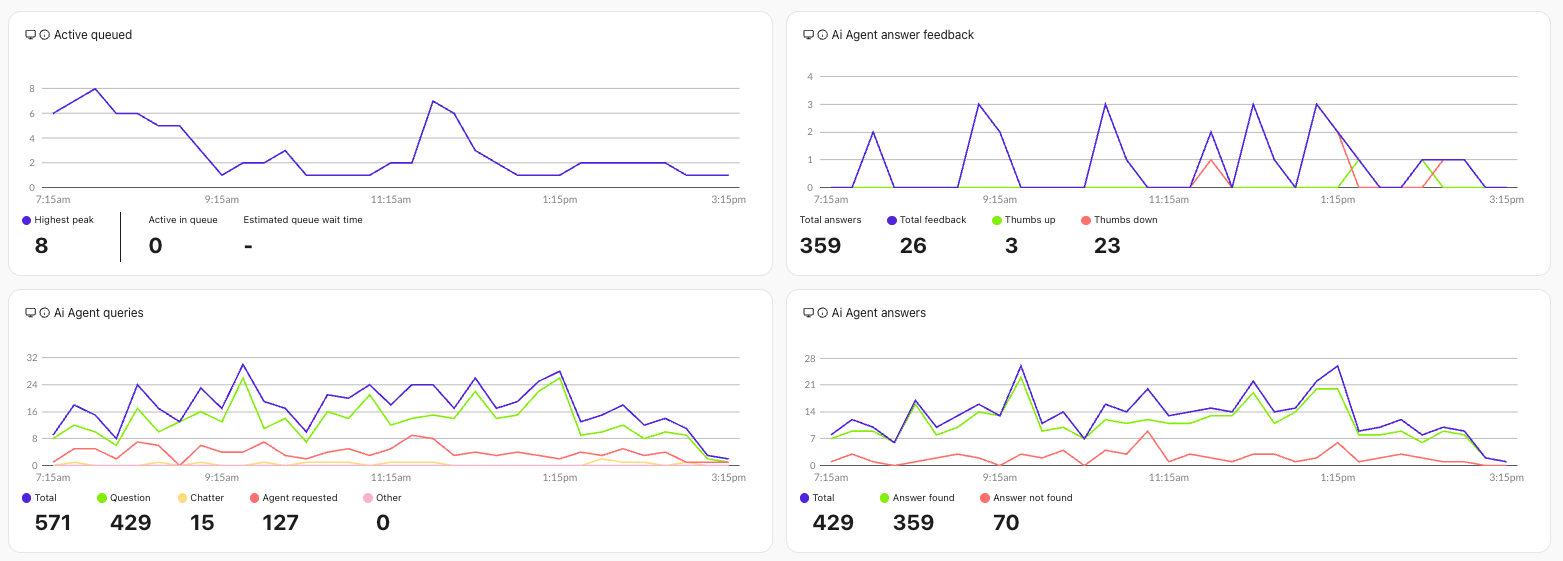
Here, you’ll find the following data points:
Ai Agent answer feedback | Displays the number of thumbs-up and thumbs-down feedback given to your Ai Agent’s answers. The numbers at the bottom display the totals for each feedback type. |
Ai Agent Queries | Displays a breakdown of question types asked to your Ai Agent. *Dig into user intent by looking at the ‘Other’ category. |
Ai Agent Answers | Displays how many questions were answered (or unanswered) by your Ai Agent. *The numbers at the bottom display the totals for each classification. |
Active Queued | Displays the number of customers currently waiting to be connected. |
Agent leaderboard
Use the Agent leaderboard to review agent performance and easily see who is on a call or not.
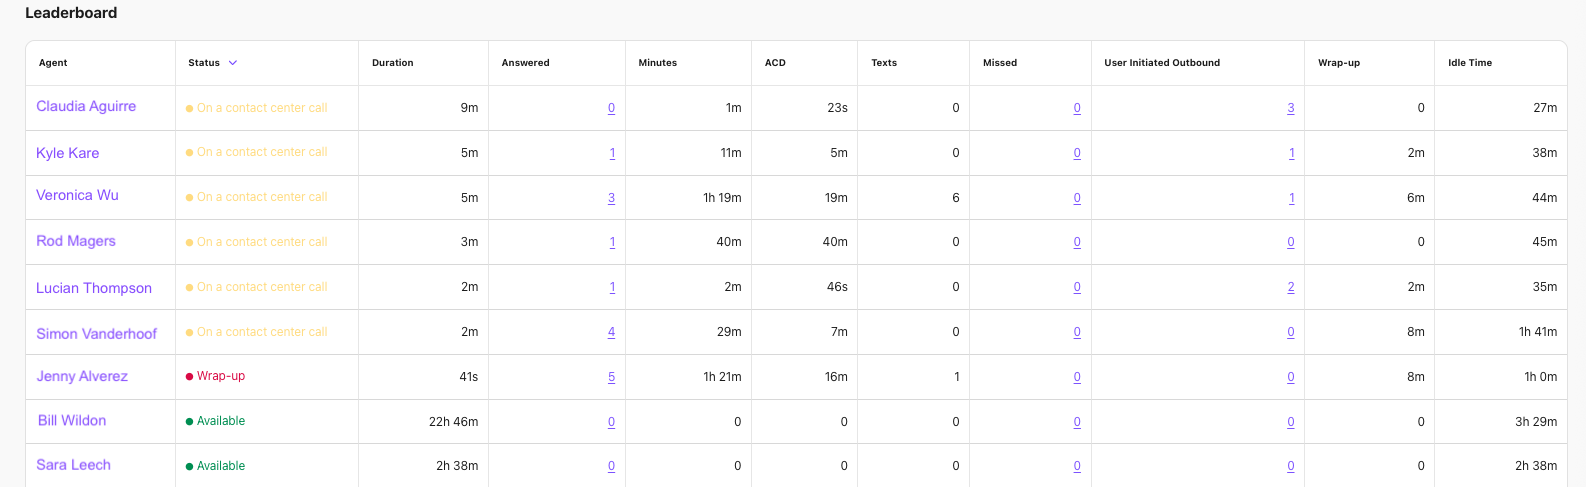
Here, you’ll find the following data points:
Status | The agent’s current status. |
Duration | How long the agent has been in their current status. |
Answered | How many calls/interactions the agent has answered. |
Minutes | The total number of minutes the agent has spent with a customer. |
ACD | The agent’s average call duration |
Texts | The number of texts the agent has actioned. |
Missed | The number of calls the agent has missed. |
User Initiated Outbound | The number of outbound calls the agent has started. |
Wrap-Up | How long the agent has spent in a wrap-up state. |
Idle time | How long the agent has spent in an idle state. |
Select an agent and you'll be taken to the Call History menu for their subset of calls.
Visit this Help Center article to learn more about Contact Centers.
Frequently asked questions
Below are some questions that have commonly come up for Contact Center dahsboards.
Why does the total row of the "Agents Available" column on the All Contact Centers dashboard not add up to the sum of the numbers in the rows for all the Contact Centers above it?
The total row for Agents Available calculates the number of distinct agents. Remember, an agent can be available in more than 1 Contact Center at the same time.
Which agents are included in the agent leaderboard and agent status widgets?
The agent leaderboard and agent status widgets display active users belonging to the Contact Center that are being viewed.
Cancelled, deleted and suspended users will not be shown on the leaderboard, nor will anyone who has not yet accepted their Dialpad invite.
How often does data refresh?
Data is displayed in real time.
Can I see digital SLAs?
Yes. As part of an Early Adopter Program, Dialpad offers a new digital SLA widget. Contact your Customer Success Manager if you’d like to try this functionality.
The widget will display the chat and email SLAs for the selected digital contact centers. Select Full List to see the individual SLAs for each contact center. 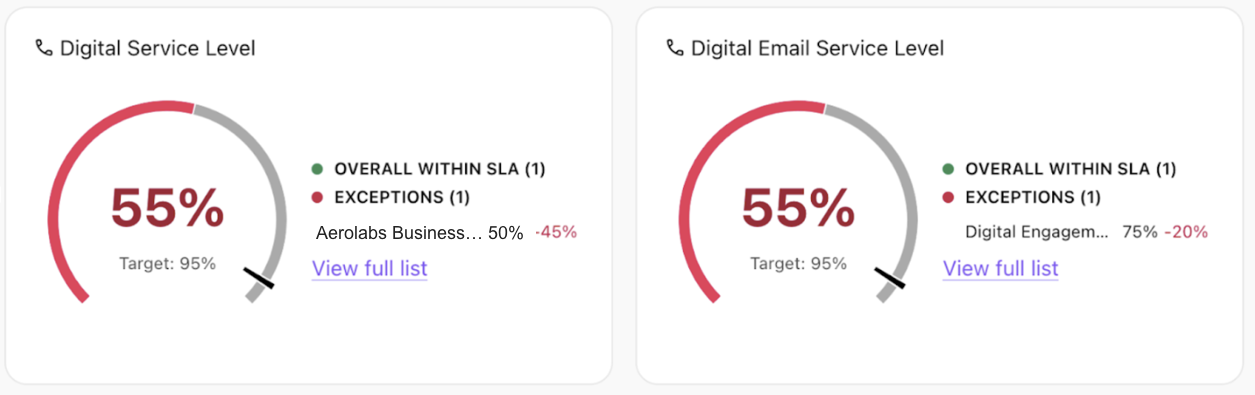
Note
If you have selected only one digital contact center, you’ll see a single number in the widget.