.png)
We’re on a mission to completely transform how the world works together and our team works around the clock designing groundbreaking, truly unified products — all powered by the most advanced communications Ai in the world!
We're always rolling out updates containing new features and capabilities to ensure you get the most out of Dialpad. Let's take a look at a feature we have coming out soon.
Who will this impact?
Contact Center Admins and Supervisors who are actively monitoring their live Contact Center metrics.
What is changing and why?
Contact Center dashboards unlock real-time performance insights through metrics such as call duration, speed to answer, Agent status, hold times, and much more.
Dialpad's legacy dashboard provided insights into only one Contact Center's data at a single time, and for Supervisors and Admins managing multiple Call Centers, the manual process to switch between dashboards was time-consuming.
We've curated a brand new dashboard that puts all your most frequently viewed data points into one location, allowing you to simultaneously view data from multiple Call Centers.
How does it work?
With our new Multi Contact Center Dashboard, you can filter for specific Call Centers and time parameters.
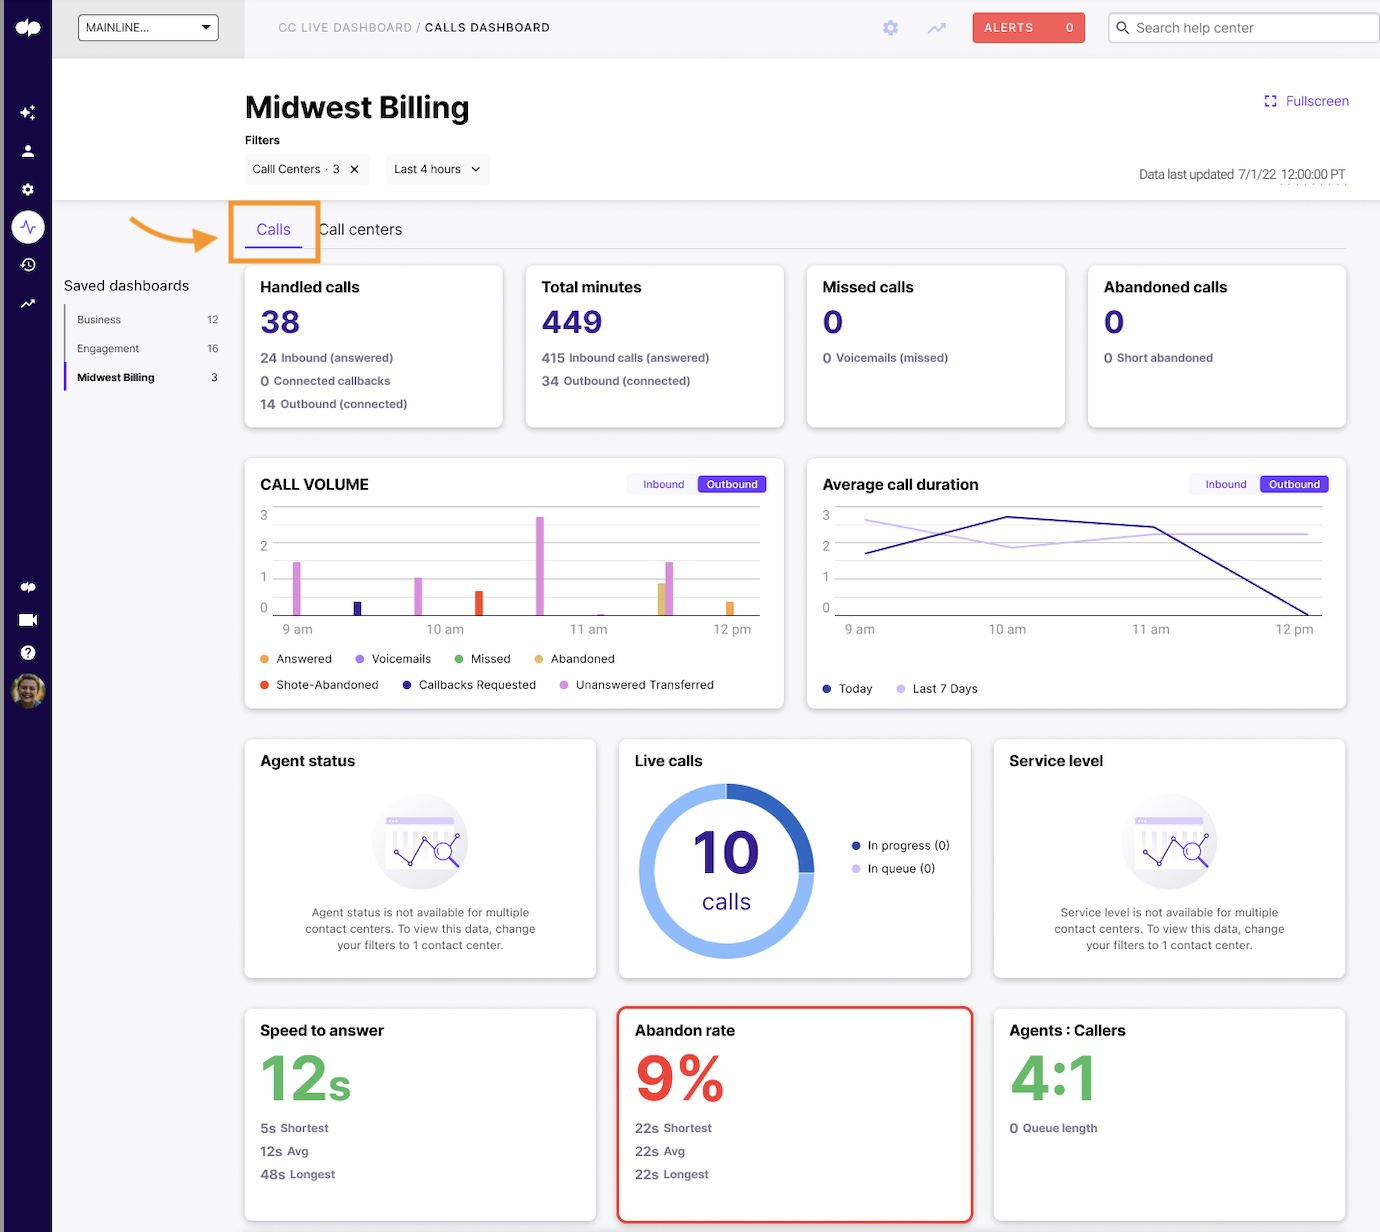
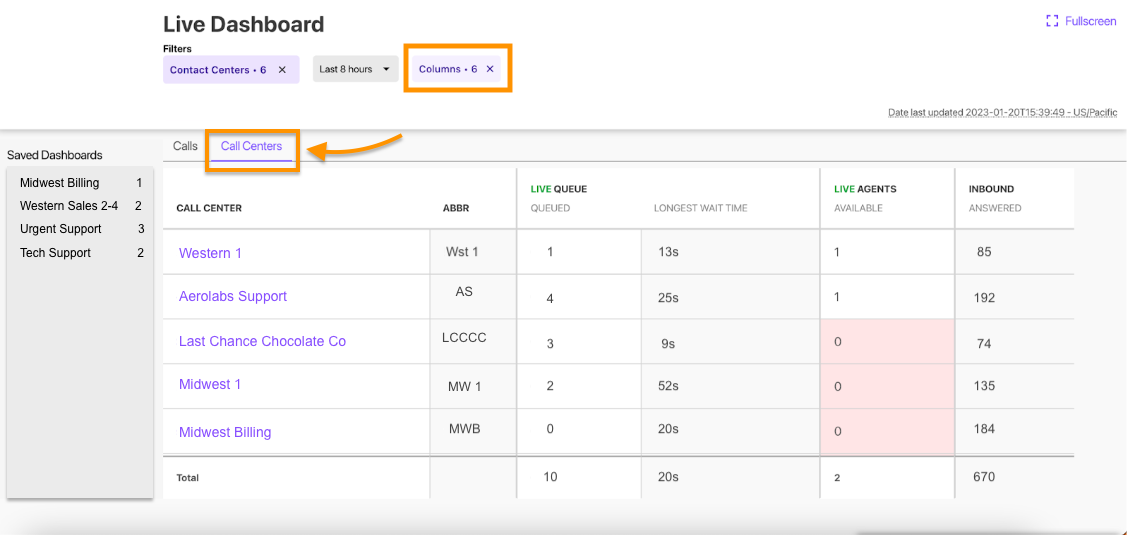
We've divided the Live Calls section into two new dashboards, Calls and Call Centers.
Calls Dashboard
The Calls tab displays metrics on:
- Handled calls
- Total minutes
- Missed calls
- Abandoned calls
- Call volume
- Average call duration
- Speed to answer
- Abandon rate
- Agent-to-caller ratio

*Agent Status and Service Level metrics will not appear on the Multiple Contact Center Dashboards, but rest assured our team is working on this.
Call Centers Dashboard
On the Call Centers tab, you're able to customize your dashboard by selecting the desired columns.
Filter your columns by:
- Contact Center name
- Abbreviated Contact Center Name
- Queued calls
- Longest wait time
- Number of Available Agents
- Number of Agents in wrap-up
- Number of answered calls
- Number of abandoned calls
- Number of missed calls
- Number of voicemails
- Number of connected calls
- Number of canceled calls
- Average speed to answer (ASA)
- Service level
- Call Duration

Saved Dashboards
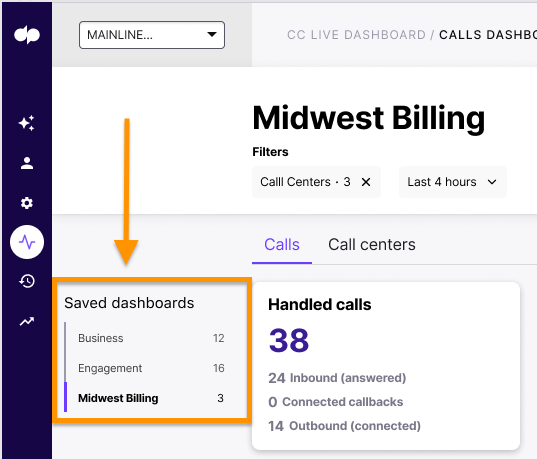
That’s not all! With our new Multiple Contact Center Live view, you can also save your searches for efficient monitoring — no need to manually set filters every time.
- Select the desired Call Centers from the drop-down filters (click to select)
- Select the desired timeframe
- Click Save new dashboard
That's it! Your new saved dashboard will appear on the sidebar, ready to be viewed at any time.

When will this be released?
This view was released in March, 2023