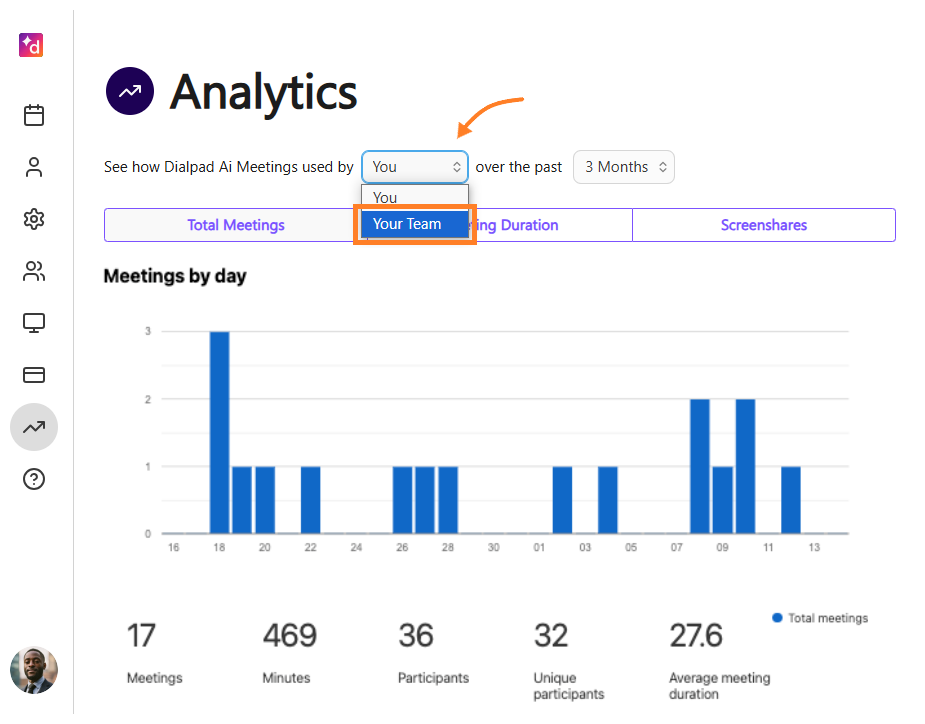
Use Dialpad Meetings Team Analytics to understand user performance across your team. Admins can see daily calls, minutes, and screen shares volumes for the entire team and individual users.
Let's dive into the details.
Who can use this
To access team analytics, you must be a Dialpad Meetings Admin with a Dialpad Meetings Business license, or a Dialpad Admin.
Analytics overview
Access your Analytics Overview from the Dialpad Meetings dashboard.
Select Menu
Select Analytics
.png)
Admins can review their team's Dialpad Meetings usage over the past week, month, or three months. Please note that same-day data is not available. The Analytics overview also includes a breakdown of total calls, call minutes, and screen shares by day.

In the Team Members section, you can view individual user performance metrics. Dialpad Meetings organizes this data into categories such as total calls, total minutes, average call length, average participants per meeting, and total participants.
Tip
You can export usage statistics into a CSV file by selecting the Export Usage Stats button in the Team Members section. The export includes all-time performance data, providing a comprehensive view beyond a specific time period.
Available metrics
Dialpad Meetings provides the following metrics:
Total meetings: Total number of meetings.
Total meeting minutes: Total number of minutes spent in meetings.
Total screen shares: Total number of times a screen was shared.
Total number of participants: Total number of meeting participants.
Total number of unique participants: Total number of unique meeting particpants.
% of meetings that included screenshare: The percentage of meetings where someone shared their screen.
% of meetings viewed online: The percentage of meetings that were viewed in a browser.
Average meeting duration: The average duration of meetings.
Average number of participants per meeting: The average number of participants per meeting.
Admins can view metrics for their whole team, or individual users within their team (including themselves).
Note
Every broadcast counts as one screen share. If two people share during one conference, that will count as two screen shares.