Dialpad BI offers layer upon layer of unique customization capabilities.
We know this can be a lot to digest, and so we've put together a cheat sheet of tips to ensure you get the most out of your reports.
Definitions of fields
When customizing a report, hovering over a field and clicking on the "info" ⓘ icon will often show you a definition. 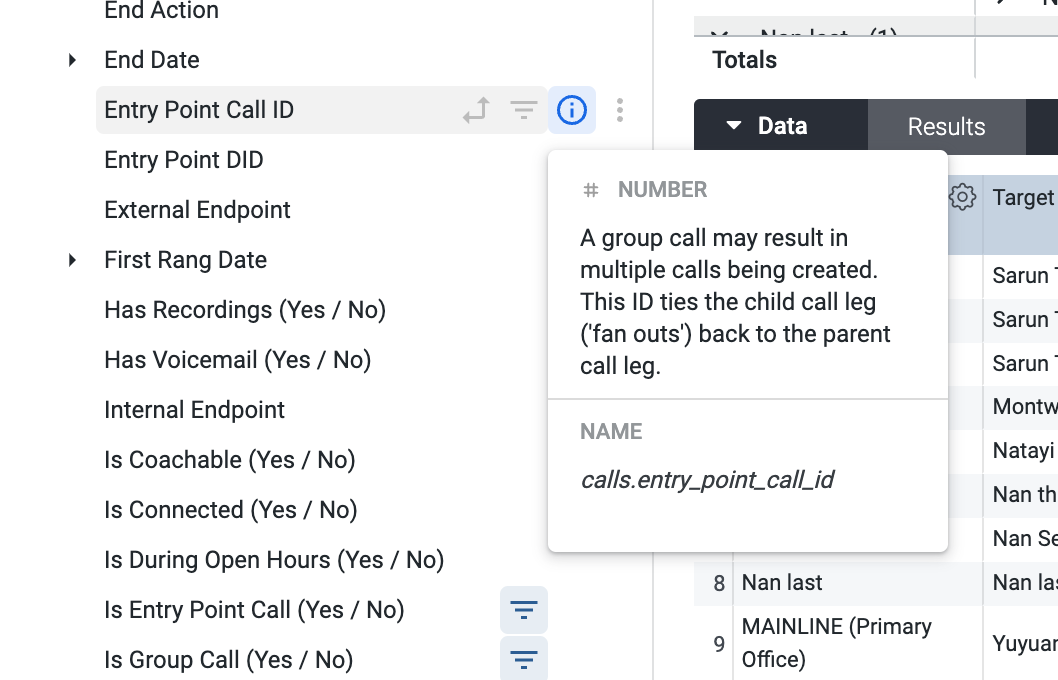
You can also hover over a column name in the customization or report view pages to get that same definition.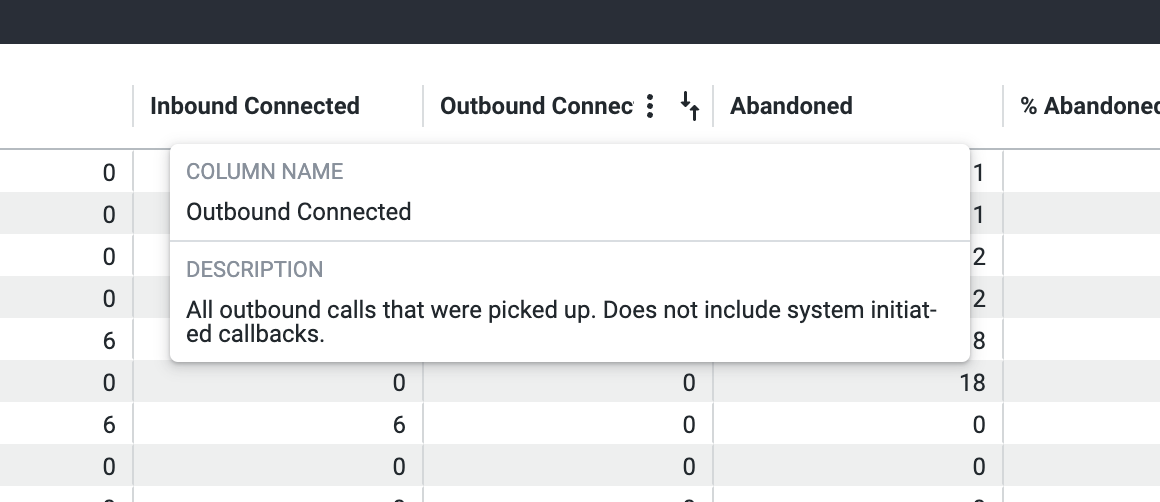
Have a look at the Analytics Glossary article for more common definitions and descriptions.
Date aggregation (by day, week, month, etc.)
One of the most common customizations is date formatting, to ensure your reports export and can be viewed with your preferred date periods.
Let's take a look at how to change the date aggregation periods used when customizing a report.
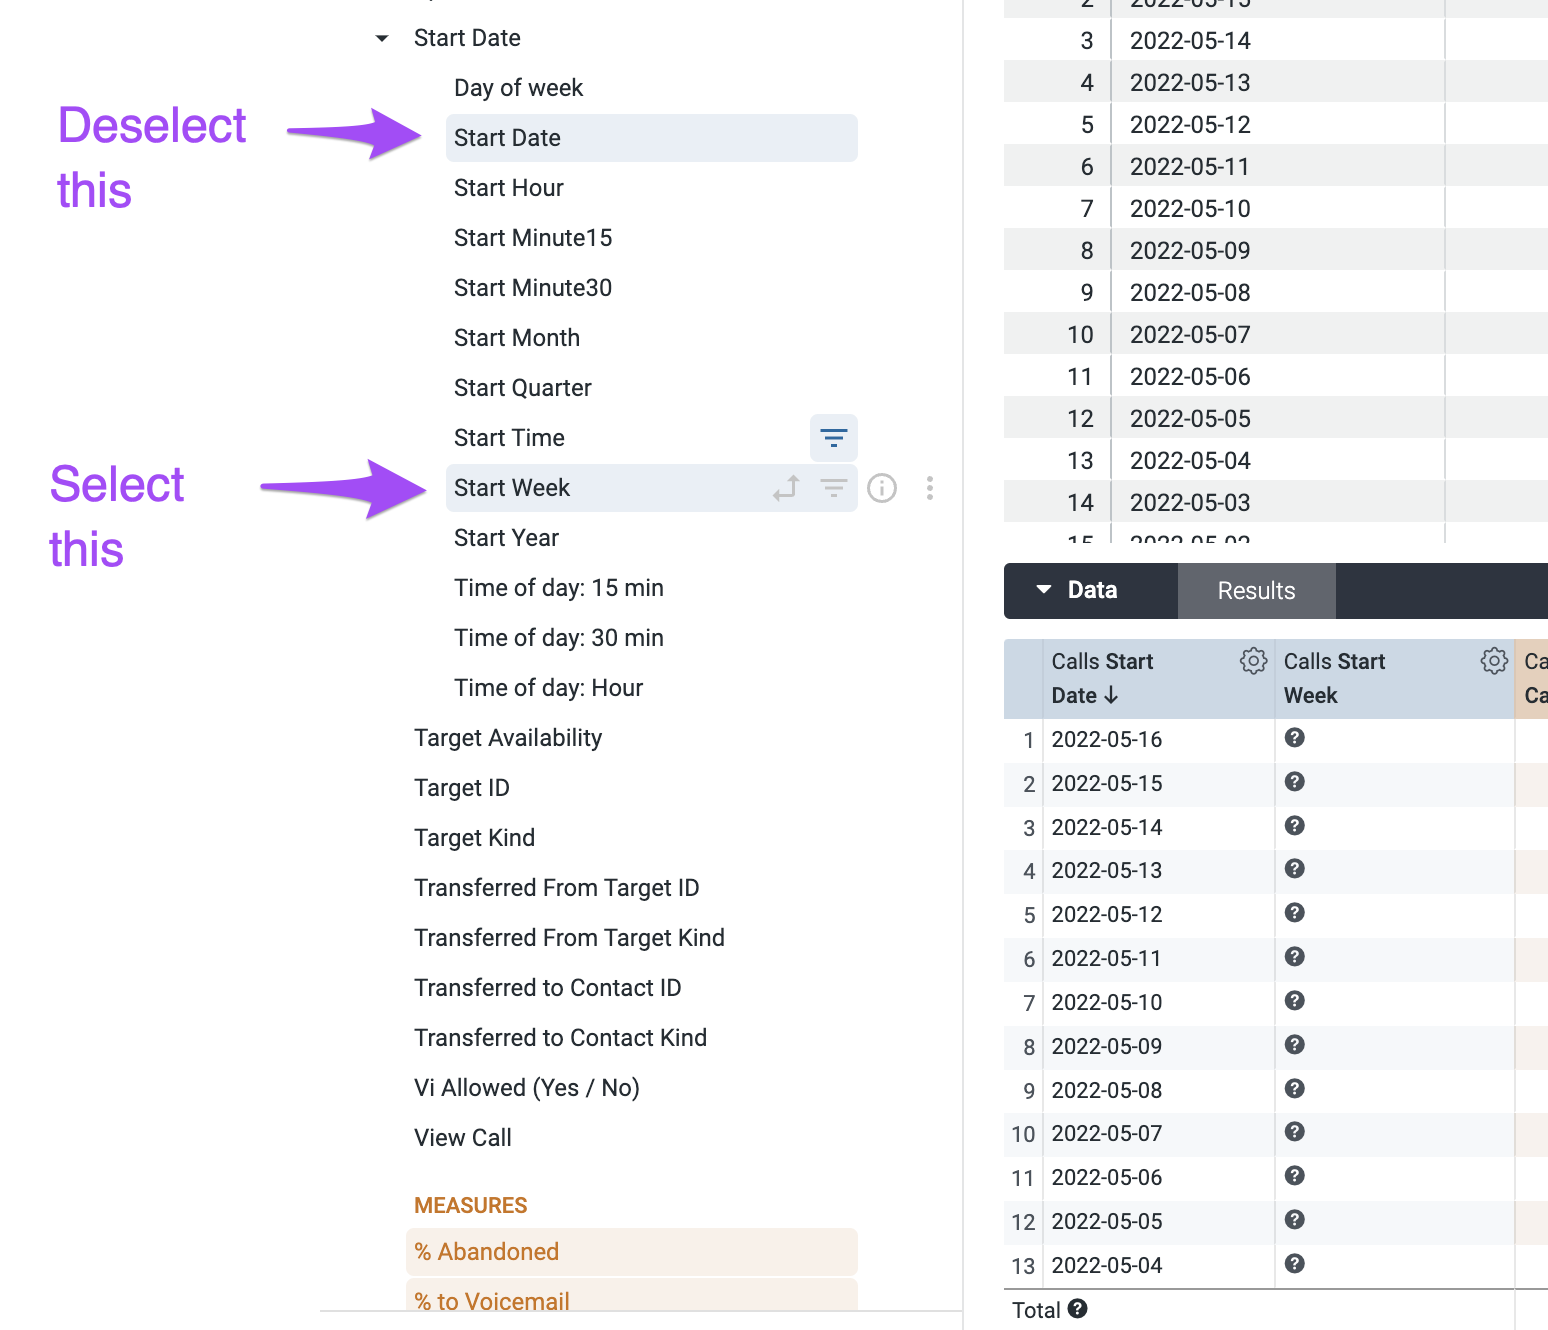
Select the desired date field (i.e. Start Date)
Deselect the existing date parameter that you're using, if any (i.e Start Date)
Select the appropriate date field that you want to aggregate by (i.e. Start Week)
Select Run to update your report
Converting Fractional Times into HH:MM:SS formatting
This can be accomplished most easily using Table Calculations when customizing your report.
We find the field that has been added to our report, convert it from seconds into days by dividing by (60*60*24), and then we can specify a HH:MM:SS format to be used.
See an example of this below
Downloading data using Excel
If your BI report contains call IDs that exceed 15 digits, the report displays the call ID as “0” when downloading your BI report using Excel. To mitigate this, we suggest doing the following:
Download your BI report as a .csv file
Follow the instructions shown in this resource
Getting group vs individual user vs combined metrics
Coming soon
Filtering fanout calls in or out
Coming soon
Custom timing intervals and heatmaps
Coming soon
Using drill downs to test your report customizations
Coming soon
Collapsing sections to make more space
Coming soon