Dialpad's 'Call Volumes by Day' report provides a detailed view into your contact center's call volume patterns. With an easy-to-understand heatmap format, you can easily identify anomalous days where call volumes spiked, spot unusual trends, and clearly see seasonality patterns.
Let's get into the details of this report.
You'll also need to be on a Dialpad Support or Dialpad Sell plan.
Default Filters
This report contains 2 default filters:
- Calls is Entry Point Call
- Calls Start Time

Visualization Type
The 'Call Volumes by Day' Report is a templated report displayed in a heatmap format.

Hover over any given day to view the total number of calls, and the exact date.

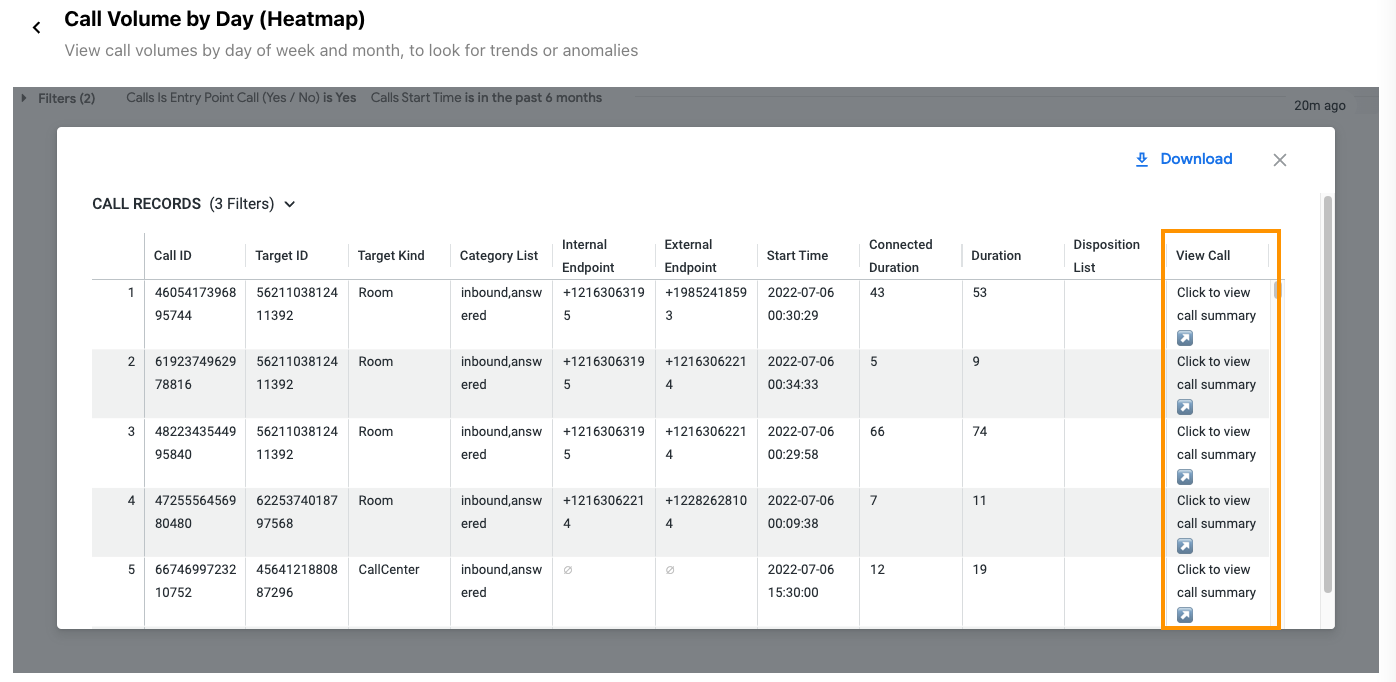
Click the day to view a pop-up of the call records — call duration, start time, disposition, and call summary — without having to leave the page.

Select 'Download' to instantly save your data to your computer, with multiple formatting and selection options.
While the 'Call Volumes by Day' heatmap is powerful on its own, when leveraged together with the 'Call Volume by Hour and Day of Week' you can see exactly when the influx of calls occurred.
Data Dictionary and Refresh Rates
This report contains unique Analytics definitions — read through the following table to learn more about the data in your report, and how soon it comes available after a call.
Columns | Description | Availability after Call |
|---|---|---|
Call ID | A unique call ID for every call.
| 5 Minutes |
Target ID | Unique ID automatically assigned to the Office, Department, user, or group. | 5 Minutes |
Target Kind | Indicates whether the target was an Office (Main Line), Department, Call Center, Router, room, or user.
| 5 Minutes |
Category List | A list of tags used to classify a call's outcome - answered, placed, missed, abandoned, etc. | 5 Minutes |
Internal Endpoint | The phone number of the Dialpad user or group who owns this call.
| 5 Minutes |
External Endpoint | The phone number of the external party contacted for this call. | 5 Minutes |
Start Time | The date and time that a call is received by the Dialpad system. | 5 Minutes |
Connected Duration | Length of time the call was connected. This is based on the connected and end dates of the call. | 5 Minutes |
Duration | Time from when the call was created to the time it ended. | 5 Minutes |
Disposition List | Comma separated list of descriptive labels applied to the call by an operator.
| 5 Minutes |
View Call Summary | Link to this call's summary page on Dialpad. Recording availability and permissions will apply when opening. | 5 Minutes |