Using Dialpad Business Intelligence (BI)
- 13 Dec 2024
- 6 Minutes to read
- Print
- DarkLight
- PDF
Using Dialpad Business Intelligence (BI)
- Updated on 13 Dec 2024
- 6 Minutes to read
- Print
- DarkLight
- PDF
Article summary
Dialpad Business Intelligence allows customization of metrics and reports based on Dialpad data. Users can access, create, duplicate, customize, filter, visualize, run, download, send, and schedule reports. The tool offers dimensions and measures for data analysis, with options to add, remove, and update fields. Reports can be downloaded in various formats and sent to recipients. Users can drill down into data, view call records, and access additional resources for assistance. The tool provides a comprehensive business intelligence solution for analyzing and managing Dialpad data effectively.
Did you find this summary helpful?
Thank you for your feedback
Dialpad Business Intelligence (BI) offers the robustness of a full-featured business intelligence tool directly on top of your Dialpad data. It's your data, your way - Dialpad BI lets you customize the metrics you want, in the format you want.
Let's dive into the details below.
Who can use this
Dialpad BI is available for Dialpad Support or Dialpad Sell users.
This feature is a paid add-on, and you'll need to have company admin or analytics specific permissions.
Access and permissions
Dialpad BI is available to company admins, as well as users with analytics permissions for their account. Learn more about admin permissions here.
The data available is for the entire company, though it will not directly include content or links to recordings, transcripts, or any other confidential information.
If needed, the call records will have a link available to a call summary, where recordings and transcripts are accessible, should the user have the necessary viewing permissions.
Create a report
Dialpad BI offers 13 standard templated reports to get you started, or you can create a custom report from scratch.
Let's look at the options.
Use a templated report
We've done the heavy lifting and have 13 report templates ready to be populated with your data.
To use one of our templated reports, navigate to Analytics from Dialpad.com
- Select Business Intelligence
- Select the report you'd like to use (call volume by day, and agent status timeline by contact center are user favorites!)
That's it; your data is ready for review!
Create a custom report
To create a custom report, navigate to Analytics from Dialpad.com
- Select Business Intelligence
- Select Create
- Enter a Report Name
- Add a short description
- Select from the drop-down option for Report Dataset
- Select your preferred fields, filters, and visualization
- Select Save and View
Tip:
Learn more about Dialpad BI datasets in this Help Center article.
Your report will now also be visible and accessible within your Saved Reports tab
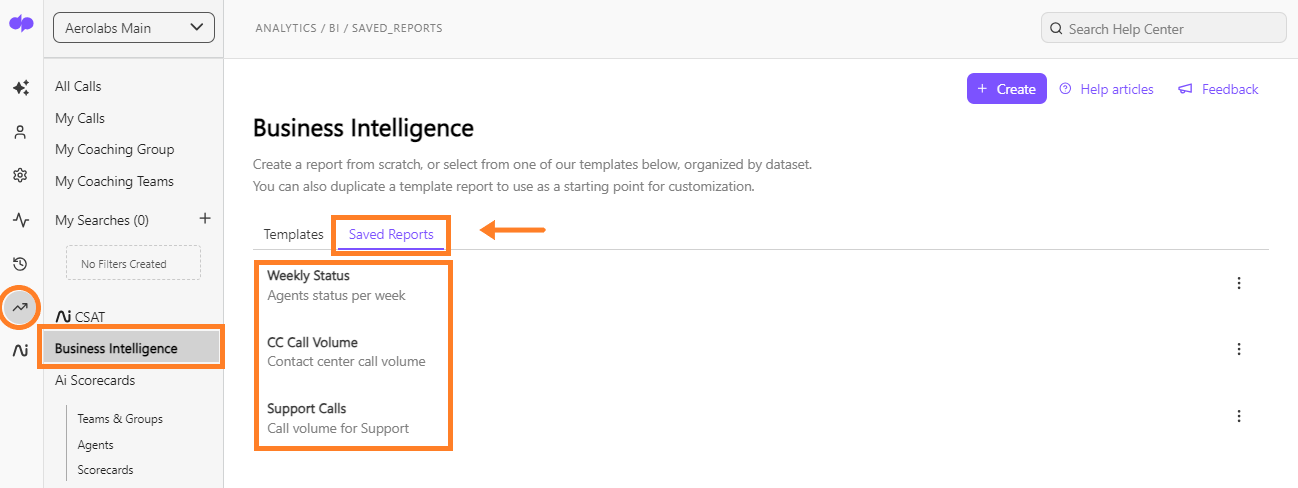
Duplicate an existing template or saved report
You can also duplicate a templated report (or one of your saved reports) to use as a starting point for further customization.
To duplicate a report, navigate to Analytics from Dialpad.com
- Select Business Intelligence
- Select the report you would like to duplicate
- Select Duplicate
- Enter a new Report Name
Upon duplicating a report, it will be saved in the Saved Reports tab of Dialpad BI and can now also be further customized and saved.
Customize a report
Below are a few important concepts to help you customize and build your own reports.
Note
These are some of the most common customization features you'll likely be using, but it is not an exhaustive list of all available functionality. Dialpad BI is built on top of Looker technology, you can read more about the other customization capabilities in Looker's help center content, including sorting, pivoting, filtering, reordering columns, removing fields, picking fields, displaying totals/subtotals, copying values, custom fields, table calculations, forecasting and more.
Fields: dimensions and measures
The data/metrics on your reports are Fields. There are two main types of fields: dimensions and measures.
A Dimension can be thought about as a core property of the entities in the dataset that you're reporting on. When making a simple 2-axis chart, you can think about dimensions as the types of things you'd generally put on the horizontal axis, or as separate lines/bars/etc.
Some example dimensions might be the name of the user or group who was the recipient of a call, or the date at which the call first started ringing.
A Measure is usually a metric or computed property of the entities in the dataset that you're reporting on.
Some examples of measures are things like the total # of abandoned calls, or the average call duration of all the connected calls that you've filtered for.
When making a simple 2-axis chart, you can think about measures as the types of things you'd generally put on the vertical axis.
Adding/removing fields
Fields can be added/removed in several ways, let's take a look at some possibilities. Most commonly, you'll use the field explorer on the left side of the page
- Type the field name on the search box
- Select a field name to add to your report
- If you want to remove the field, select the gear icon for the field in question
- Select Remove
- Select Save and View
Filters
Dialpad BI offers powerful filtering capabilities, to ensure you can drill down into the data you need. Filters can be triggered in several different ways, let's take a look at the possibilities.
Adding/updating a filter
You may want to add additional filters on a report that you're viewing and/or customizing.
From the Analytics section of your admin portal
- Navigate to Business Intelligence
- Select the report you want to update
- Select Customize
- Select Filters to view the active filters and update their parameters as needed
- To add a filter, navigate to All fields
- Select the Filter by field icon
To filter for a field that's already in a column in the Data section of the customize experience, select the gear icon menu in the column and select Filter.
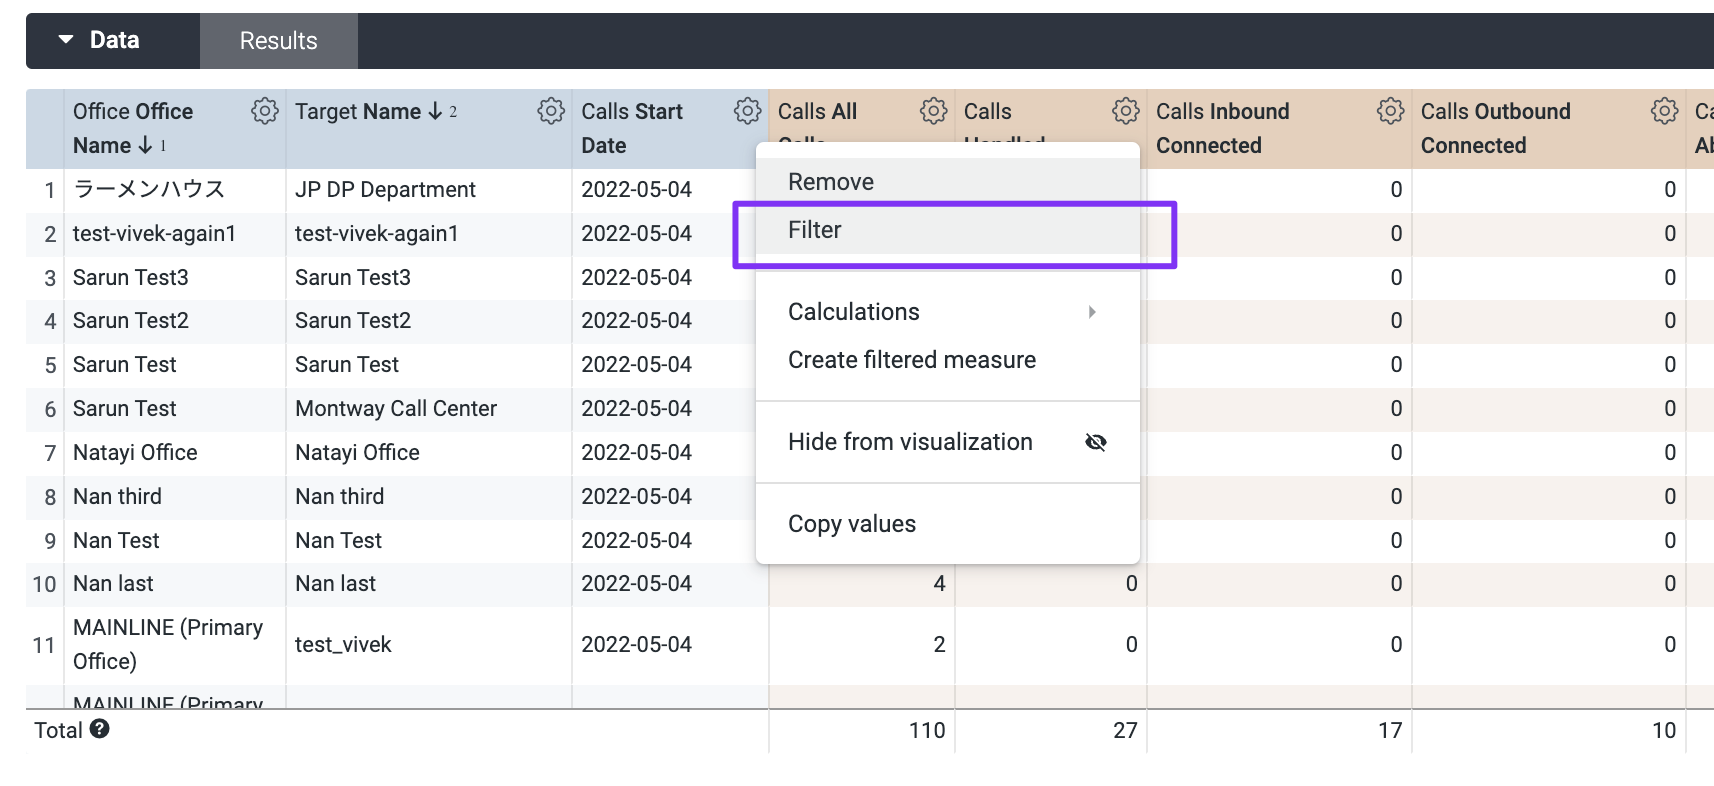
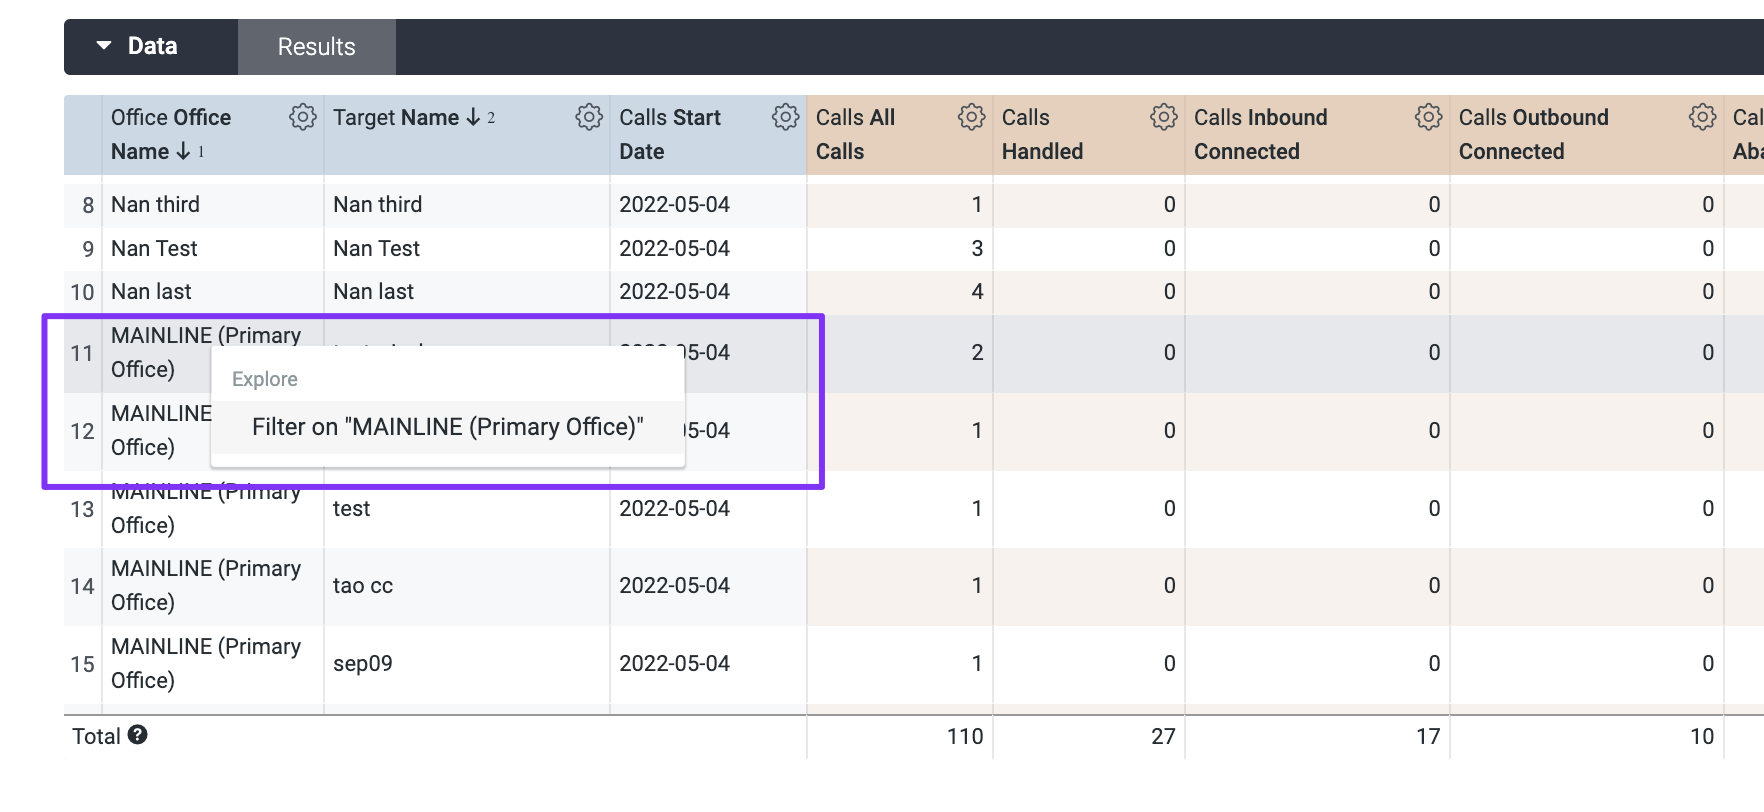
You can click on a specific row to add a filter for that column, and its selected row value.
When customizing your filter logic, there are many options available that depend on the nature of the field that's being filtered on.
For example, for dates, you can specify logic in the following methods:
- in the past X days/week/months/quarters/years, etc
- in the range X date/time to Y date/time
- is before or is after X date/time
For text fields and names, you can specify details such as:
- is equal to one or more values of your choosing
- contains/does not contain one or more sets of characters or words
- is not blank
Read more about filtering capabilities on Looker’s help site here.
Visualizations
Reports have an interactive table or chart that let you to visualize your data at a granular level.
Visualizations can tables made up of familiar rows and columns, or, an interactive diagram or chart that allows you to expand and collapse sections to further break down the data, view subtotals/totals, and more
To update the visualization type, select the report you would like to update and select Customize
- Select Visualization
- Select the visual representation format of your choice
- Select Run to update the report
- then Select Save and View
The graph will update instantly so you can compare which visual format best represents your data.
Tip:
Where applicable you can also click on the metric or data directly in the visualization to view the underlying records that make up that data point. From there, you can take further action or dive into an even deeper analysis.
Read more about the various visualization types and their customizations on Looker’s help site here.
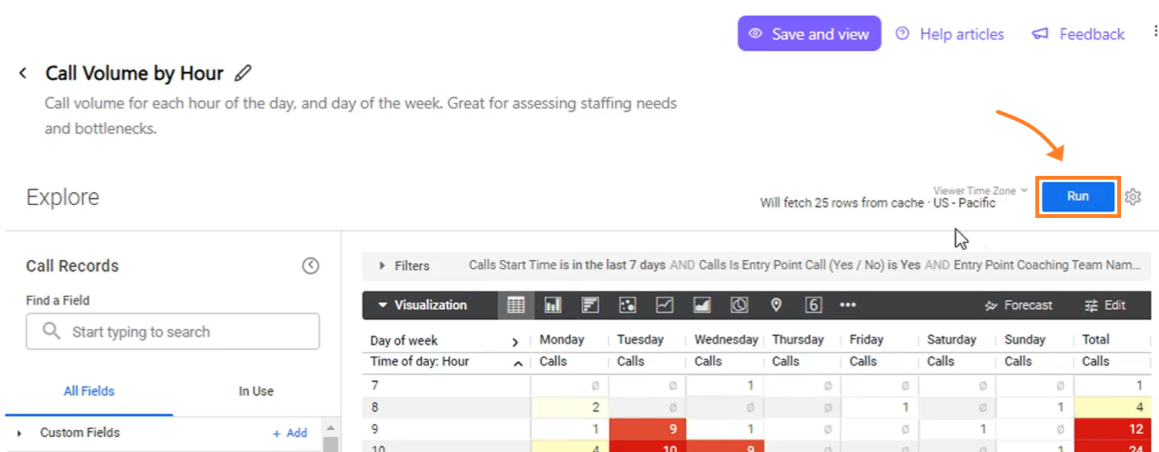
Run a report
Once you've changed the filters or data configuration on a report, you'll always need to click the "Run" button to have it populate with your latest changes.
Download a report
Dialpad BI makes it easy to download your reports by logging in to Dialpad.com and navigating to Analytics
- Select the report you want to download
- Navigate on the gear icon
- Select Download from the dropdown menu
- Select the desired file format from the dropdown menu
- Select Download.
Dialpad BI reports can be downloaded in the following formats:
- TXT
- Excel
- CSV
- JSON
- HTML
- Markdown
- PNG
Send a report
Login to Dialpad.com and navigate to Analytics
- Select Business Intelligence
- Select the report you would like to send.
- Navigate to the gear icon to access the drop-down menu.
- Select Send
- Enter the email address of the recipients and your preferred export format.
- Select Send
Reports can be sent to any email address, regardless if they are a Dialpad user or not.
Schedule a report
This is useful if you would like to set up a recurring export. E.g. Sending out relevant data insights to your team or stakeholders on a weekly basis.
Login to Dialpad.com and navigate to Analytics
- Select Business Intelligence
- Select the report you would like to send
- Navigate to the gear icon to access the drop-down menu
- Select Schedule
- Enter the email address of the recipients and your preferred export format
- Select the days/times you would like the report to be sent, and the frequency (daily, weekly, bi-monthly, monthly, etc)
- Select Save All
Drill down and download the corresponding records
See some concerning or interesting in the data? Where applicable, you can click on a specific metric in your visualization to drill down, see the underlying records for that data point, and easily download the records for deeper review if needed.
For call records specifically, you can also click through to a call summary from here, to review the corresponding recordings and transcripts where they exist and if you have the applicable permissions for that call.
Additional resources
Be sure to read through the following useful articles, and if you have any questions, please let us know!
Was this article helpful?