Digital Engagement Analytics
- 07 Sep 2023
- 5 Minutes to read
- Print
- DarkLight
- PDF
Digital Engagement Analytics
- Updated on 07 Sep 2023
- 5 Minutes to read
- Print
- DarkLight
- PDF
- New
Article Summary
Share feedback
Thanks for sharing your feedback!
As a Dialpad Digital Experience admin, there are times where you may want to check in and see how your team is performing. The Analytics page is a great place to start.
To take a look at the Digital Experience analytics, simply Navigate to your Dialpad admin settings by visiting https://dialpad.com/analytics and selecting one of the options (Operations, Engagement, Business) under Digital Engagement.
The sections below will go over each Analytics readout and what each metric refers to.
Operations map
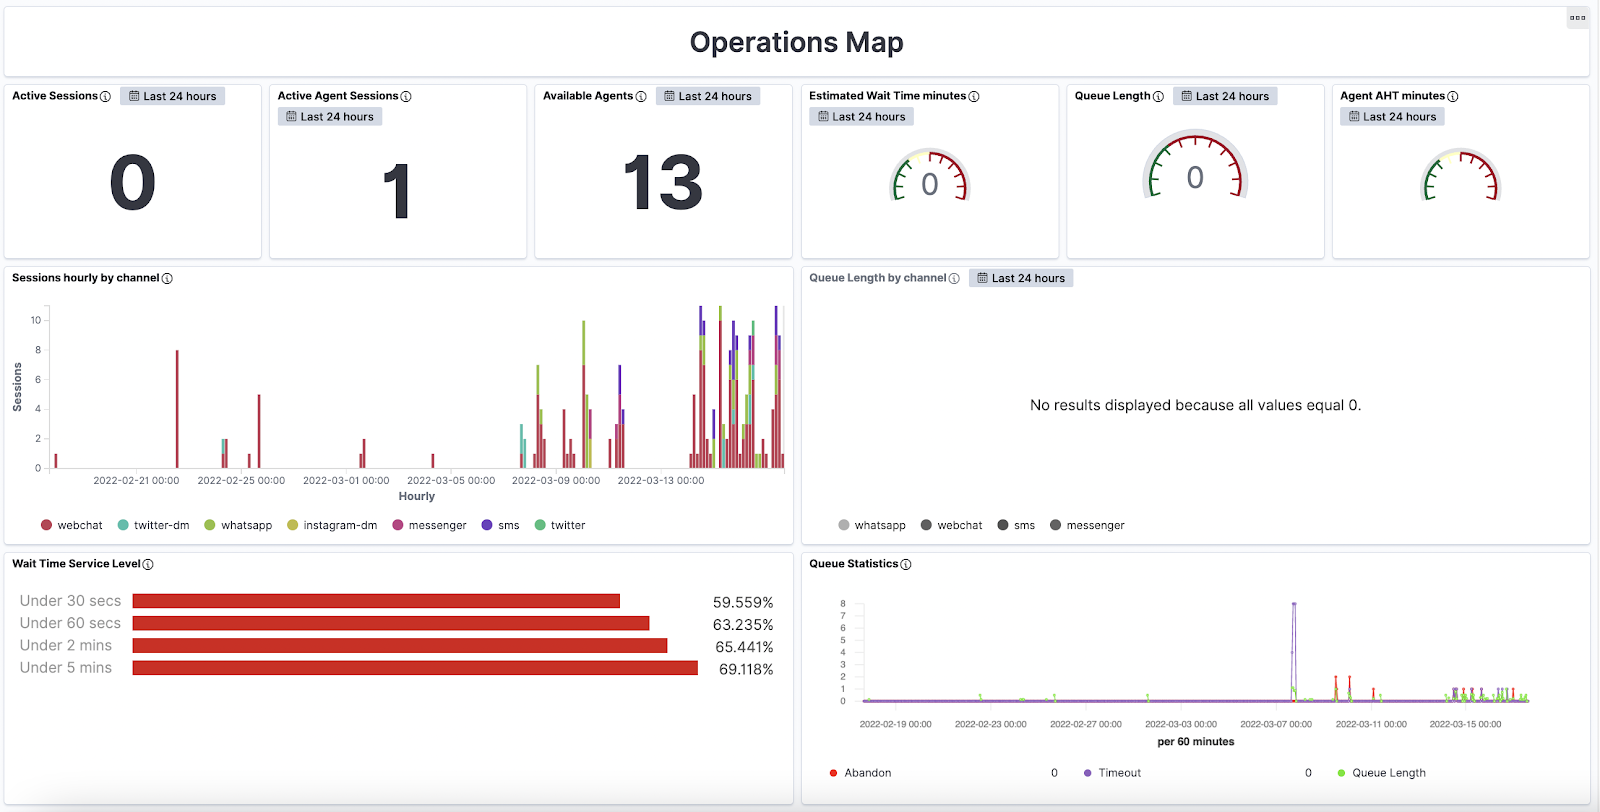
Title | Description |
Active sessions | Number of current active customer sessions |
Active Agent Sessions | Number of current active agent sessions |
Available Agents | Number of current available agents on the Dialpad Digital Experience desktop app |
Estimated Wait Time Minutes | Current queue estimated wait time in minutes overall. If the estimated queue wait time is below 10 minutes, the color will be green, between 10 and 15 minutes will be orange, and above 15 minutes will be red. |
Queue Length | Current queue length. If the current queue length is below 10, the color will be green. If it is above 10, the color will be red. |
Agent AHT minutes | Average agent handled time over the last hour, displayed in minutes. If the average agent handled time is below 10 minutes, the color will be green, between 10 and 15 minutes will be orange, and above 15 minutes will be red. |
| Sessions hourly by channel | Number of customer sessions per hour per channel. |
Queue Length by channel | Current queue depth per channel. |
Wait Time Service Level | Percentage of conversation answered in 30secs, 60 secs, 2 mins and 5 mins. If metrics are above 90%, the color will be green, between 90% and 80% will be orange, and below 80% will be red. |
Queue Statistics (Timeout, Queue Length and Abandon rate) trend line | Number of abandons, timeouts, and the queue length per hour. |
Operations Map Detailed Reports
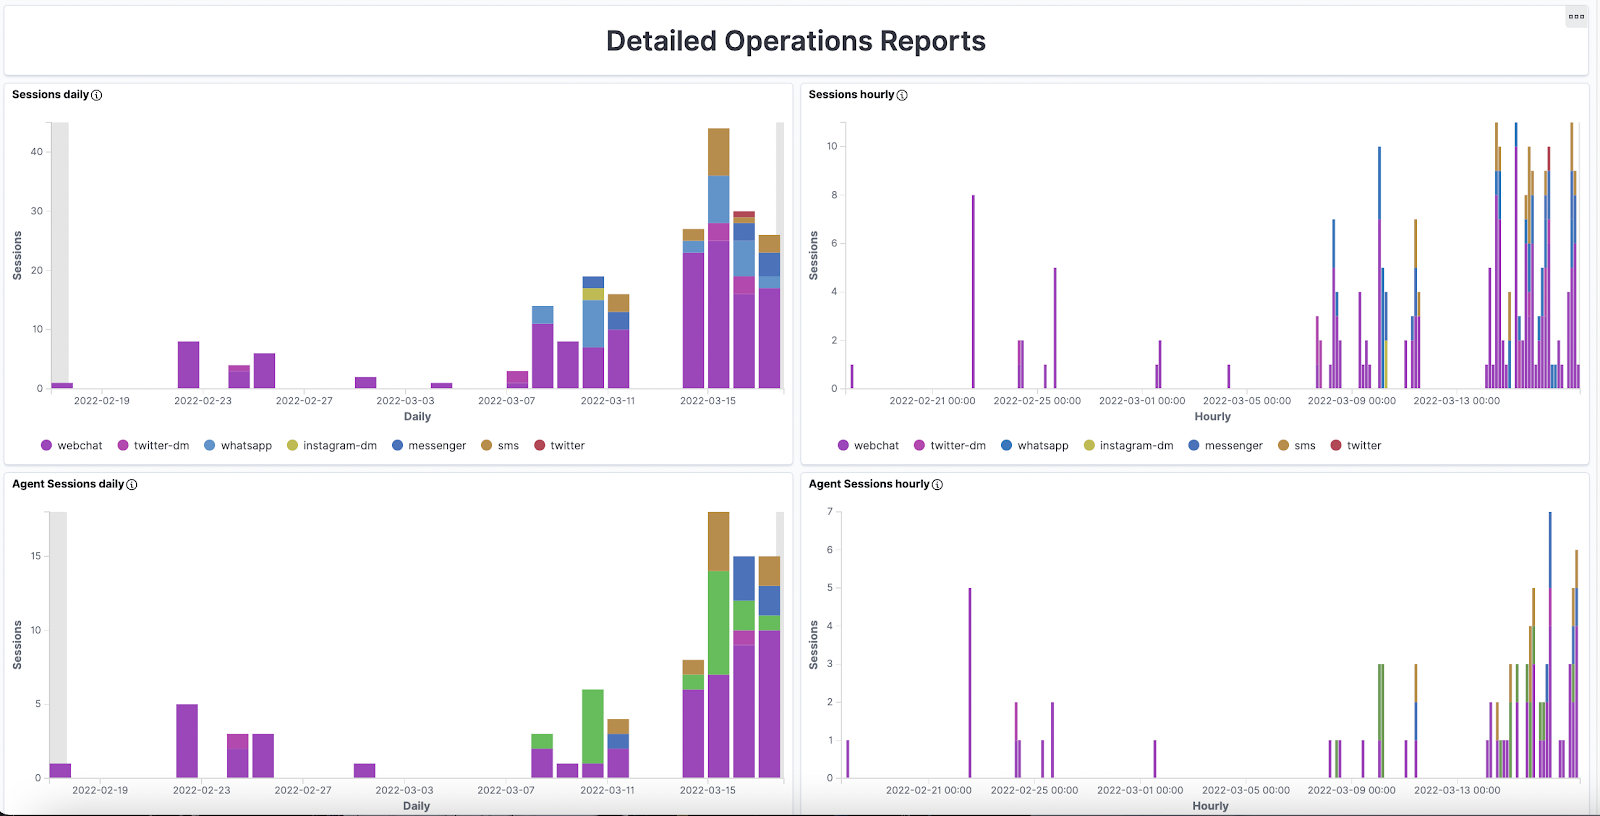
Title | Description |
Sessions daily | Number of sessions per day with channel breakdown. |
Sessions hourly | Number of sessions per hour with channel breakdown. |
Agent Sessions daily | Number of sessions with agents per day. |
Agent Sessions hourly | Number of sessions with agents per hour. |
Queue Wait Time hourly by channel | Average wait time in queue per hour per channel. |
Queue Wait Time hourly by skill | Average wait time in queue per hour per skill. |
Queue length median hourly by channel | The median of the queue depth per hour per channel. |
Queue length median hourly by skill | The median of the queue depth per hour per skill. |
Queue length by skill | Current queue depth per skill. |
Agent Sessions Duration (Channel) | Number of sessions with agents with average handle time and channel breakdown. |
Agent Productivity Daily (Channel) | This visualization shows the total number of agent sessions, the number of sessions closed without any agent messages, average handled time(AHT), the average first response time(AFRT), the average number of messages sent by both the agent and customer(ATMC-Average total message count) and the average number of messages sent by the agent only(AAMC-Average agent message count) per agent per channel per day |
Chat Queues per channel (Daily) | Number of "Agent Answered`, “Timed Out", “Abandoned”, and “Total Transferred” sessions per channel per day |
Agent Productivity Daily (Skill) | This visualization shows the total number of agent sessions, the number of sessions closed without any agent messages, average handled time(AHT), the average first response time(AFRT), the average number of messages sent by both the agent and customer(ATMC-Average total message count) and the average number of messages sent by the agent only(AAMC-Average agent message count) per agent per skill per day |
Total Sessions Monthly | Number of sessions per month in the last 12 months rounded to the month. |
Notifications Daily | Number of notifications and breakdown by notification per day. |
Agent Session Close Type Daily | Different close status of agent session. Daily Report |
Engagement Map
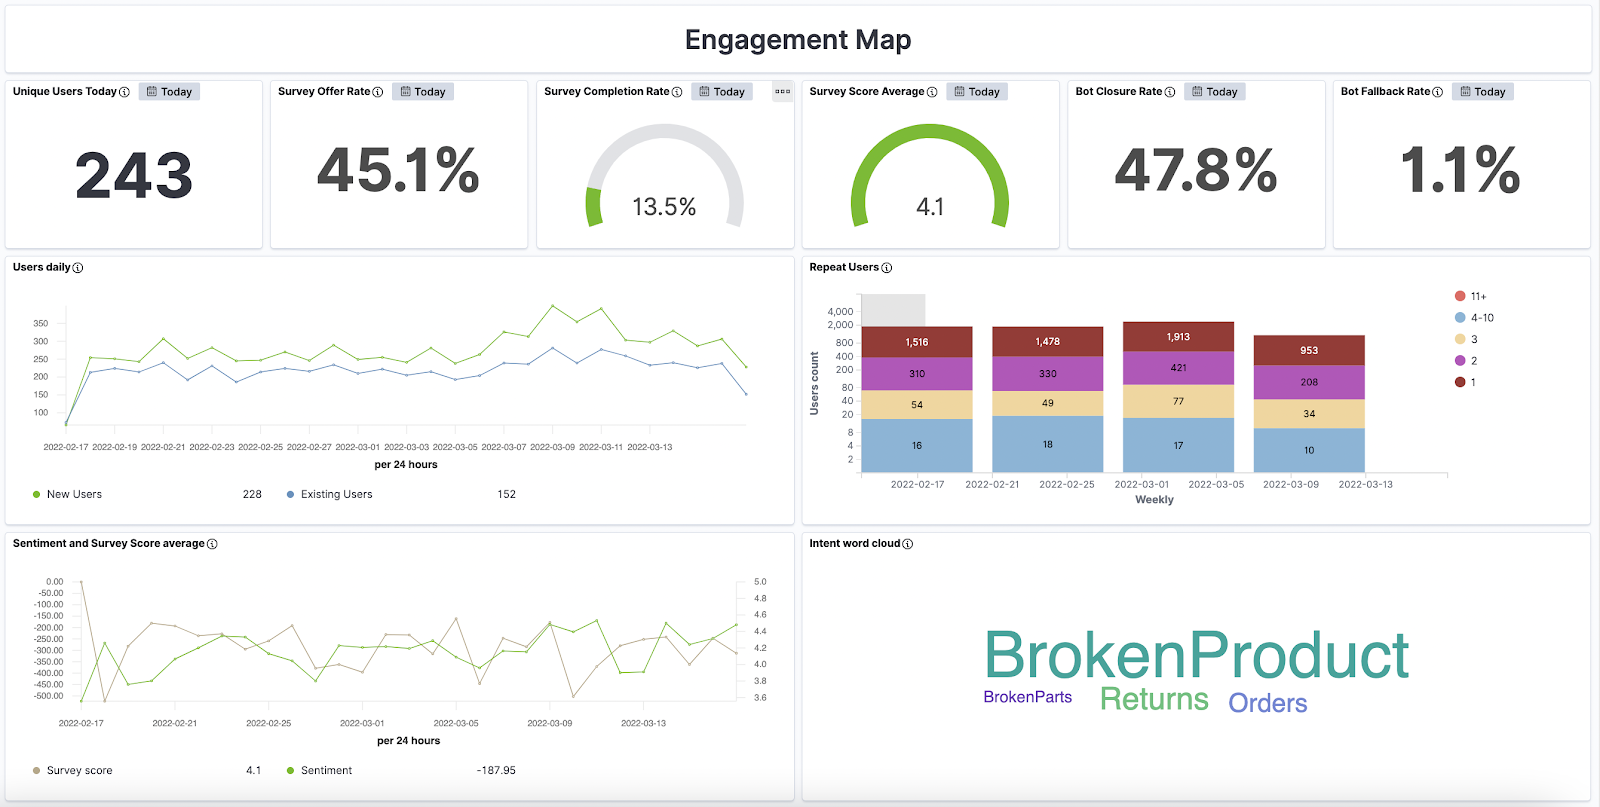
Title | Description |
| Unique Users Today | Number of unique users today. |
| Survey Offer Rate | Percentage of sessions today with surveys offered |
| Survey Completion Rate | Percentage of surveys offered today that were completed |
| Survey Score Average | Average survey score today. |
| Bot Closure Rate | Percentage of sessions which completed at the bot without an agent |
| Bot Fallback Rate | Percentage of sessions today where an intent was triggered but the bot was unable to determine the intent |
| Users daily | Number of new users and existing users per day. |
| Repeat Users | Number of users who had 1,2,3,4-10,11+ conversations in a calendar week. |
| Sentiment and Survey Score average | Average user sentiment and survey score per day |
| Intent word cloud | Top ten topics from agent sessions |
Engagement Map Detailed Reports
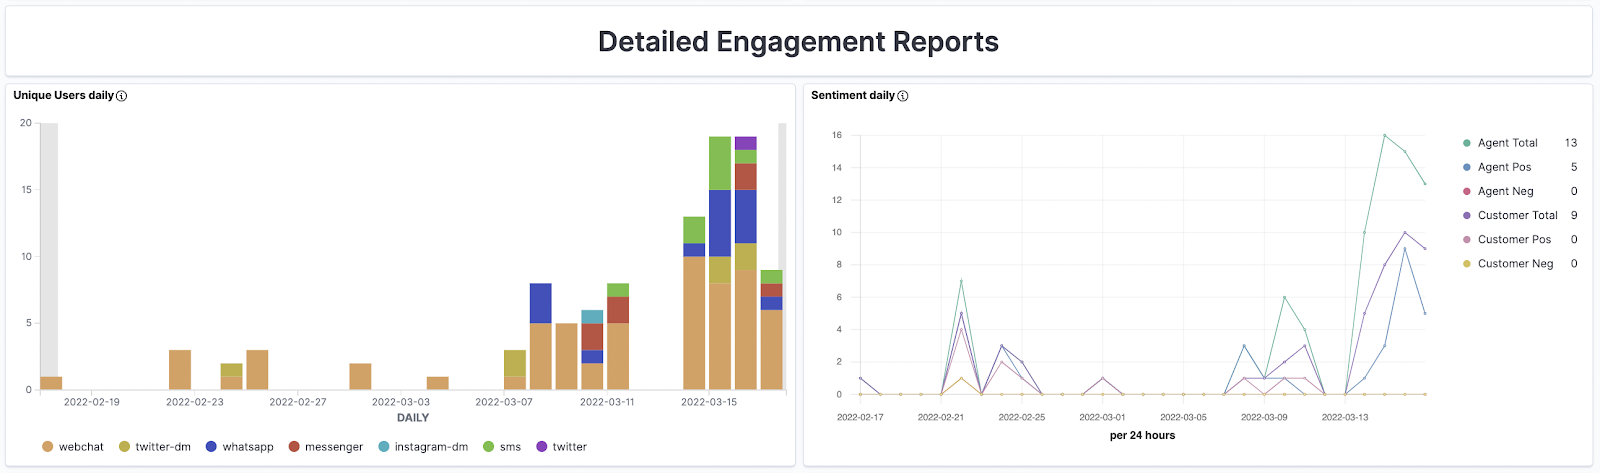
Title | Description |
| Unique Users daily | Number of unique users per day with channel breakdown. |
| Sentiment daily | Number of sessions where the agent has sent at least one message, at least one positive message, and at least one negative message & also shows the number of customer-agent sessions where the customer has sent at least one message, at least one positive message, and at least one negative message. |
| Customer Sentiment daily | Number of sessions where the customer has sent at least one message, at least one positive message, and at least one negative message. |
| Agent Sentiment daily | Number of sessions where the agent has sent at least one message, at least one positive message, and at least one negative message. |
| Bot Sessions Duration | Number of sessions in each duration bucket per bot. |
| Bot Sessions Duration per channel | Number of sessions with bot in each duration bucket with channel breakdown. |
| Survey Completion Trend daily | This visualization shows the total number of agent sessions, the number of sessions with Survey Launched, the number of sessions with Survey Completed Daily trend |
| Survey Response Per Channel daily | Count of responses per question per survey based on channel per day |
| Entry and Exit Sentiment average | The user session sentiment score average for initial interactions i.e. session entry and final interactions i.e. session exit per day |
Business Map
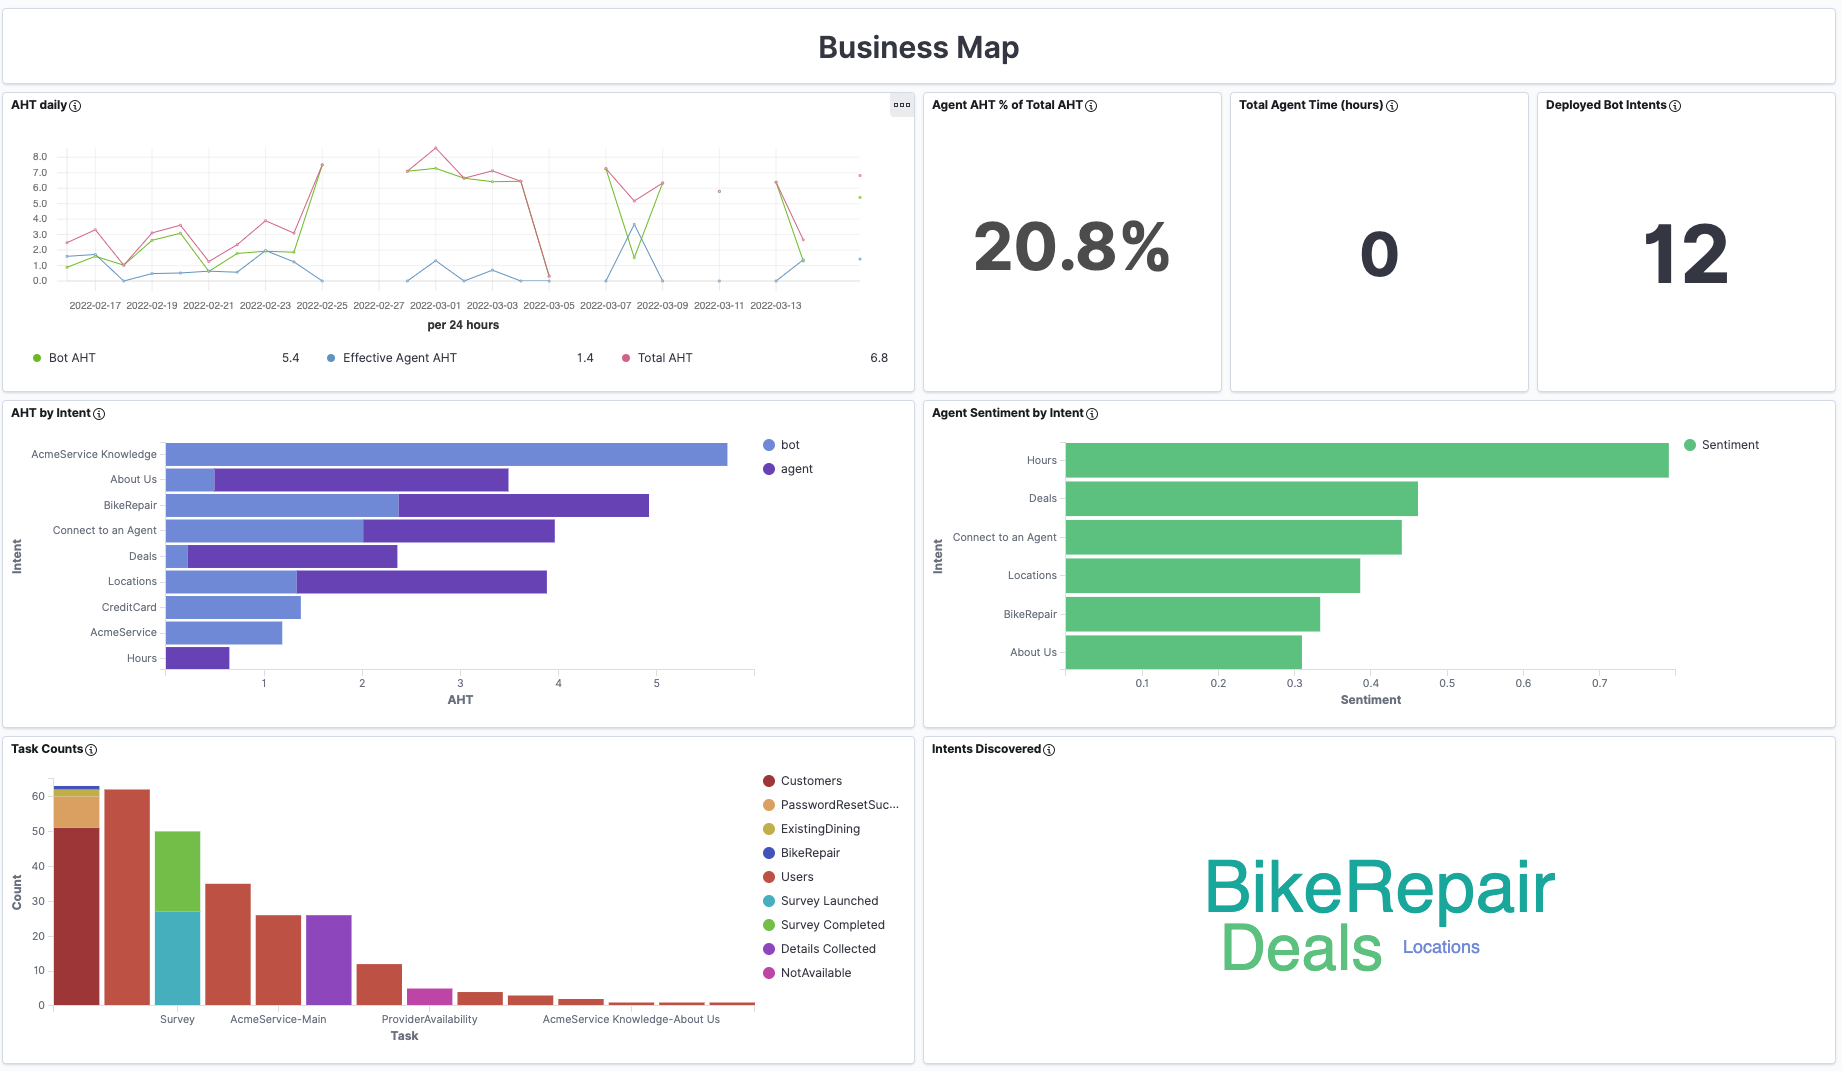
Title | Description |
| AHT daily | Average Handle Time in minutes for bot, agent and combined |
| Agent AHT % of Total AHT | Agent Average Handle Time today as a percentage of the total AHT |
| Total Agent Time (hours) | Total handle time in hours across all agents, for the past week |
| Bot Deployed Intents | Number of current intents handled by bots |
| AHT by Intent | Average Handle Time for the top intents, for bot and for agent |
| Agent Sentiment by Intent | User sentiment score for each of the top intents |
| Task Counts | Number of sessions per task with result breakdown. |
| Intents Discovered | Top ten topics from agent sessions |
Business Map Detailed Reports
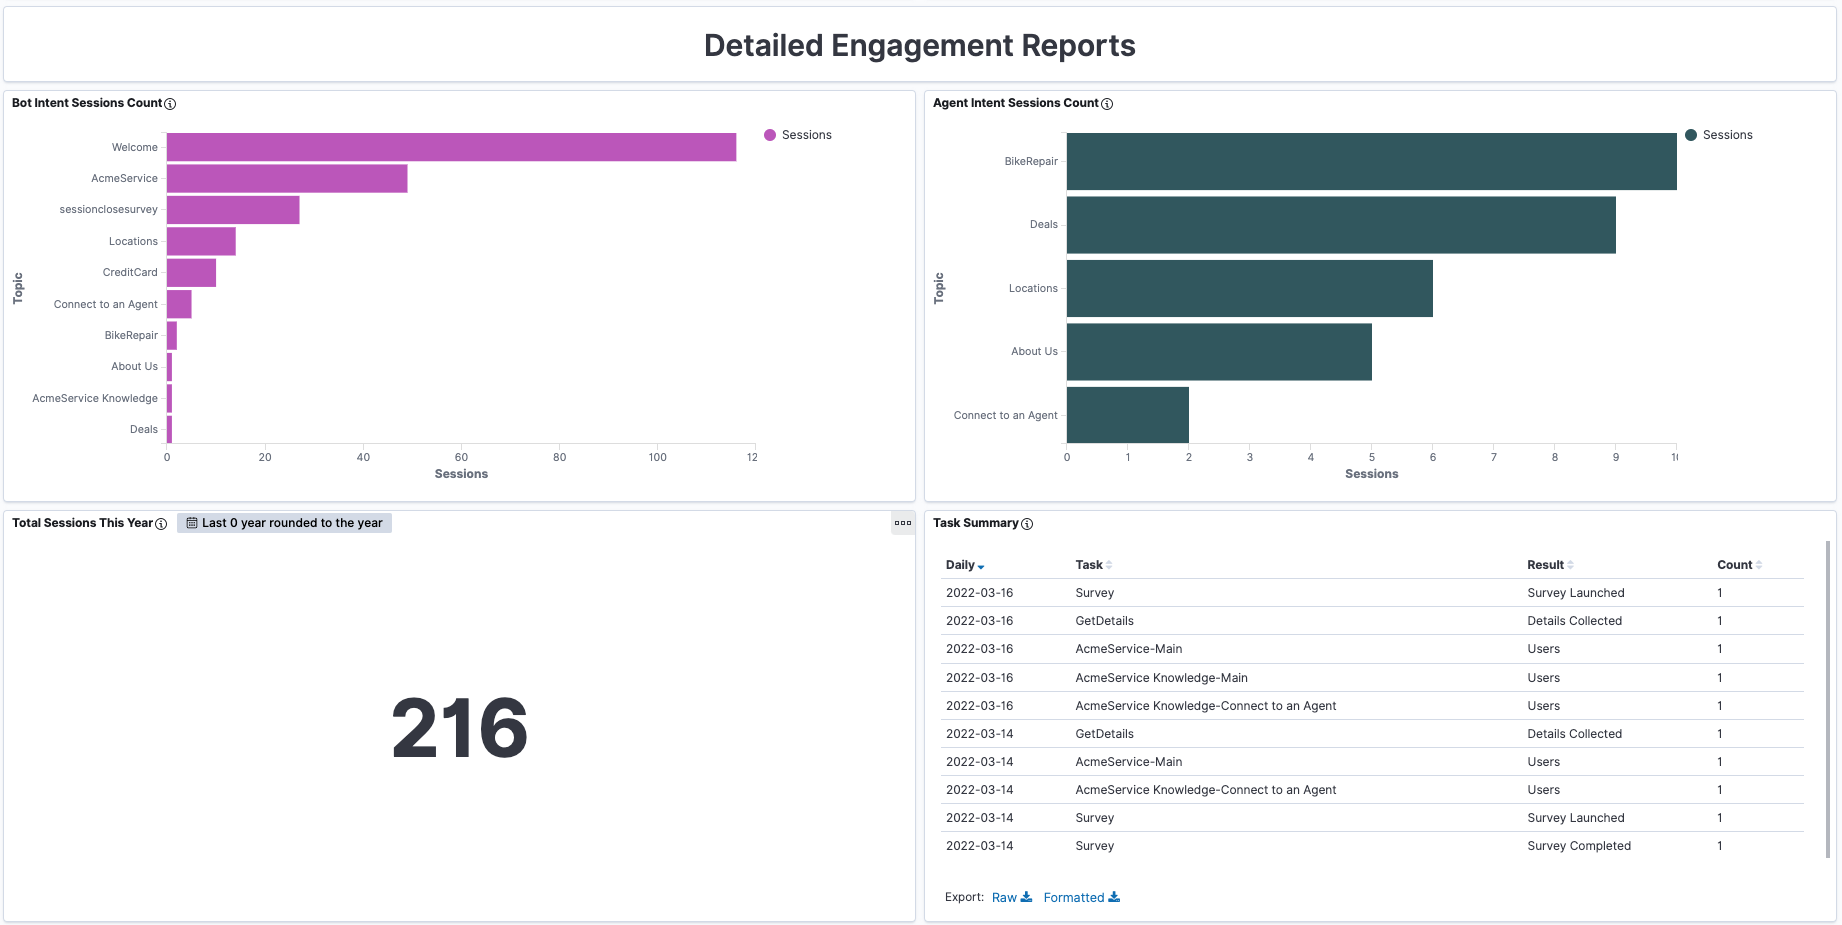
Title | Description |
| Bot Intent Sessions Count | Number of bot sessions per intent. |
| Agent Intent Sessions Count | Number of agent sessions per intent. |
| Total Sessions This Year | Total number of sessions in this year. |
| Task Summary | Count of result per task per day. |
| Tags | Number of sessions per tag. |
| Survey Comments | Word Cloud to show top 20 Comments for Survey |
Frequently Asked Questions
How will digital experience channels affect the reporting I already do in Dialpad?
When agents are actively handling conversations in digital experience channels, their call center status in Dialpad’s other dashboards and exports will reflect this time as “Off Duty” and spent in a Custom Status called “Digital”. Your dashboards and exports relating to Agent Statuses will now reflect this behavior. You can read more about custom off duty statuses and their analytics here.
Was this article helpful?