Get complete clarity on all aspects of the widget's use, including traffic exit and entry points and more, with Dialpad Self Service's deep analytics.
Let's dive into the many ways we can gain insight on the user's journey.
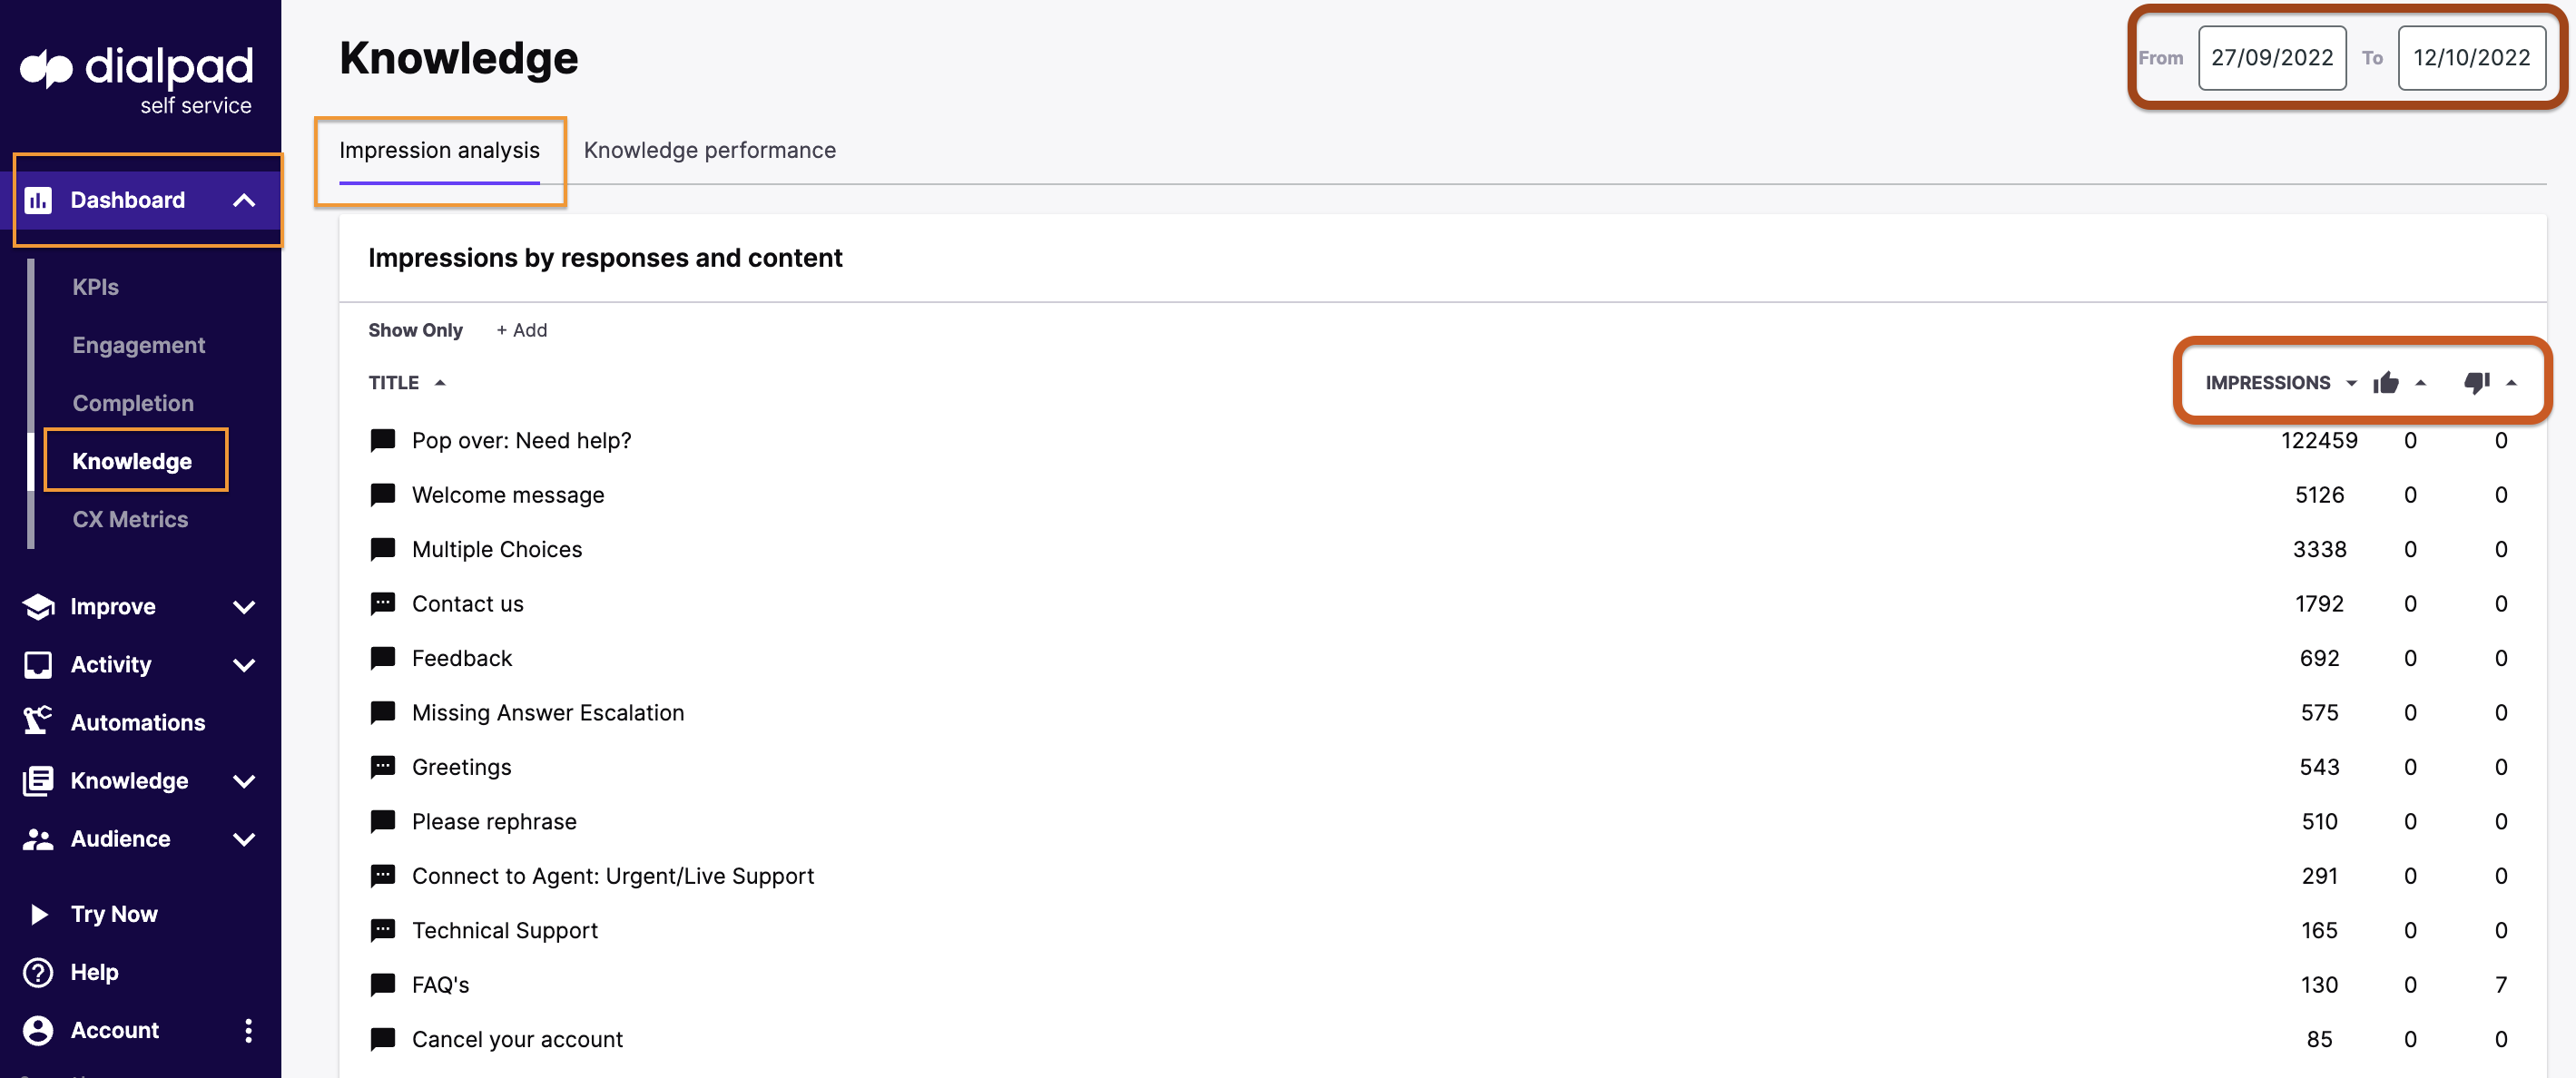
Most viewed content
Impression analysis breaks down the node activity by the total number of impressions, responses and content.
- Navigate to your Dashboard
- Select Knowledge
- Select the Impression analysis tab
Drill into your data by filtering by date, response title, CSAT or even total impressions.
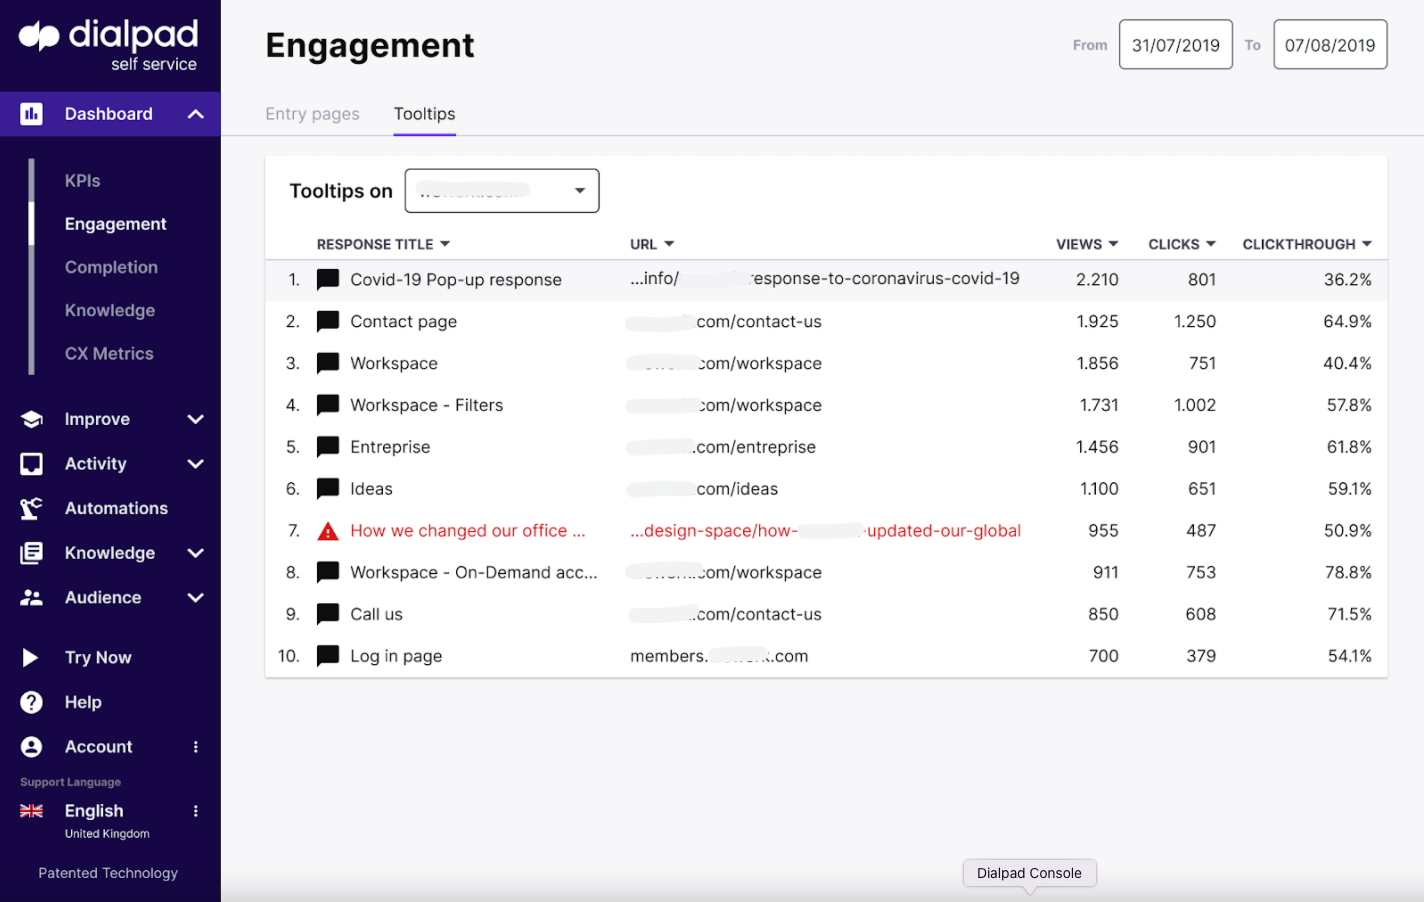
Engagement location
Analyze your user's engagement location data by seeing where they started conversations and what questions were asked.
From your Dashboard, navigate to Engagement
The User's origin location can indicate specific processes on your platform where customers are having problems, leading them to start a conversation with the widget.
Contextual tooltips
Deploy proactive tooltips to help guide customers where they may be experiencing difficulties.
The Tooltips tab (found in your Dashboard under Engagement) allows you to dive into the clicks, click-through-rate and views for each tool-tip.
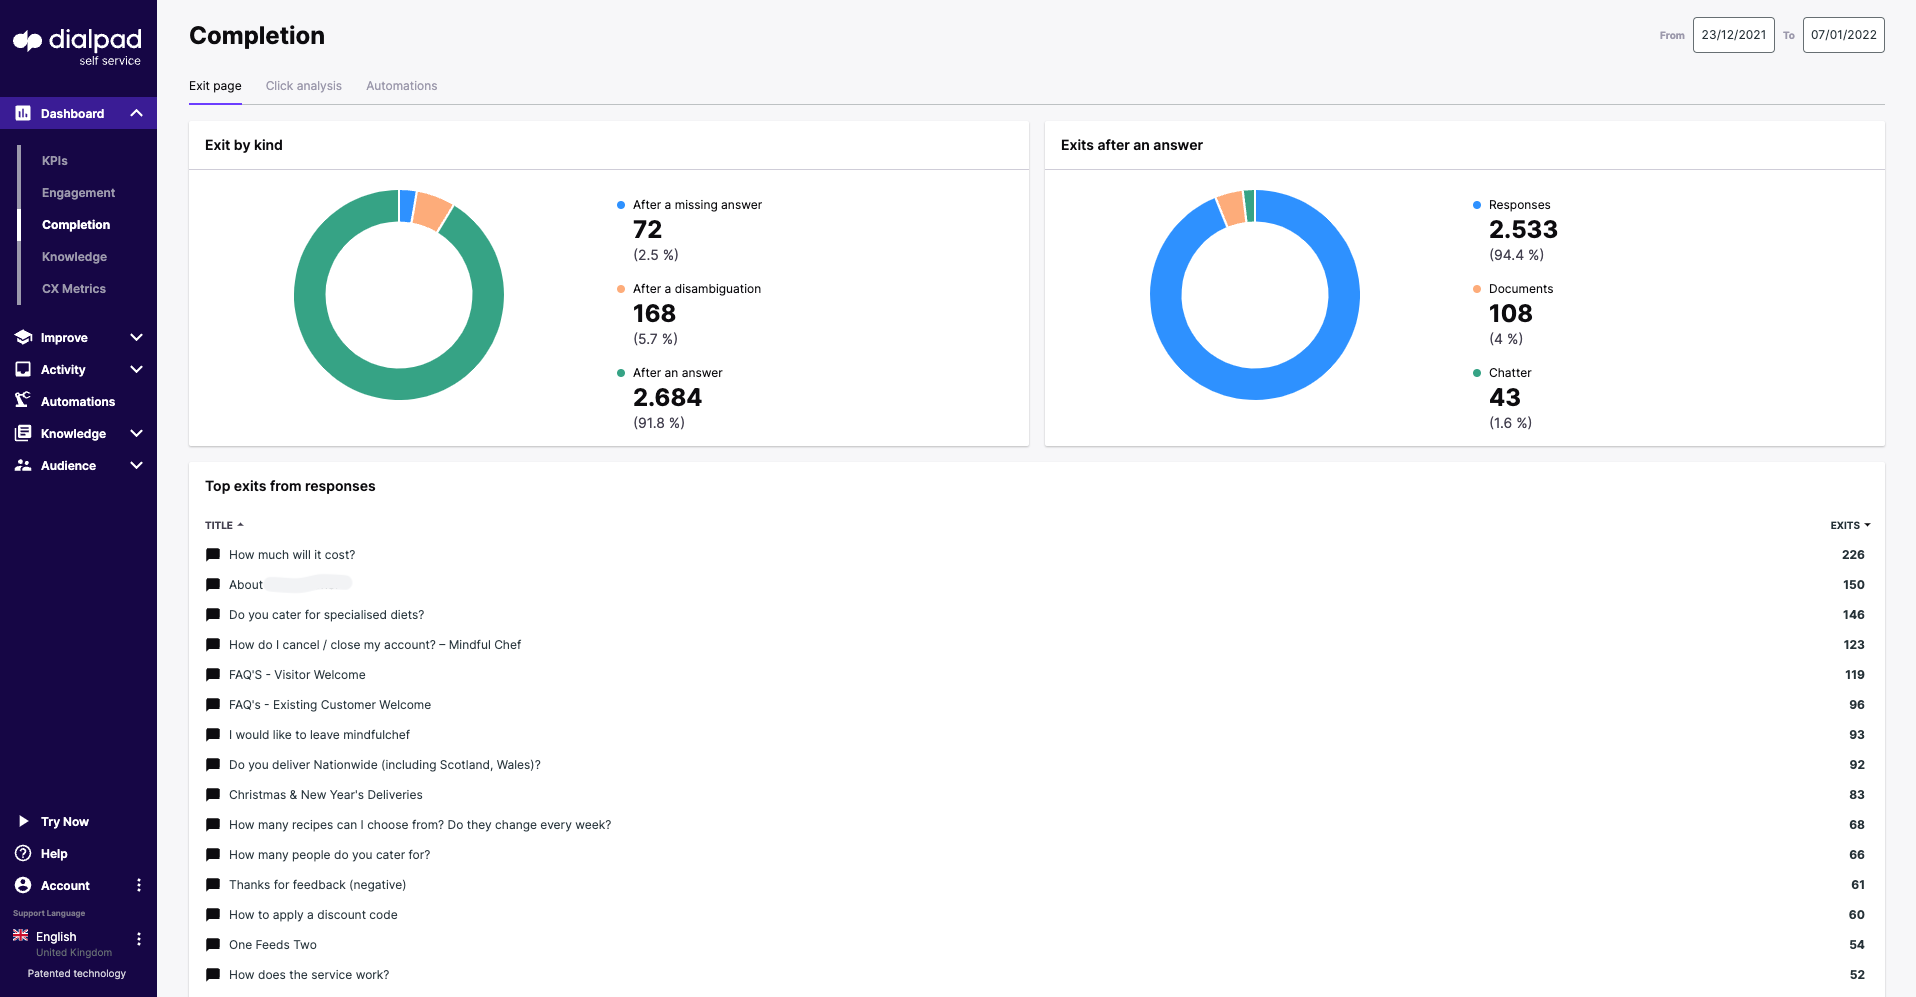
Exit experience
Analyze your user's completion data (where they stopped interacting with the widget and the accuracy of the bot's response) to gain an understanding of their full user experience.
We break down exits from the widget by search result success, and then show the type of nodes for those exits that have occurred after an answer to assess the usefulness of the responses provided to the customer.
We also break down the total number of impressions and click through percentages on links provided.
Identifying automation opportunities
The automations tab identifies where the escalations are occurring the most and indicates where automation could be suggested to further boost the deflection rate either with configurable features included in the widget or additional RPA’s/web extensions.
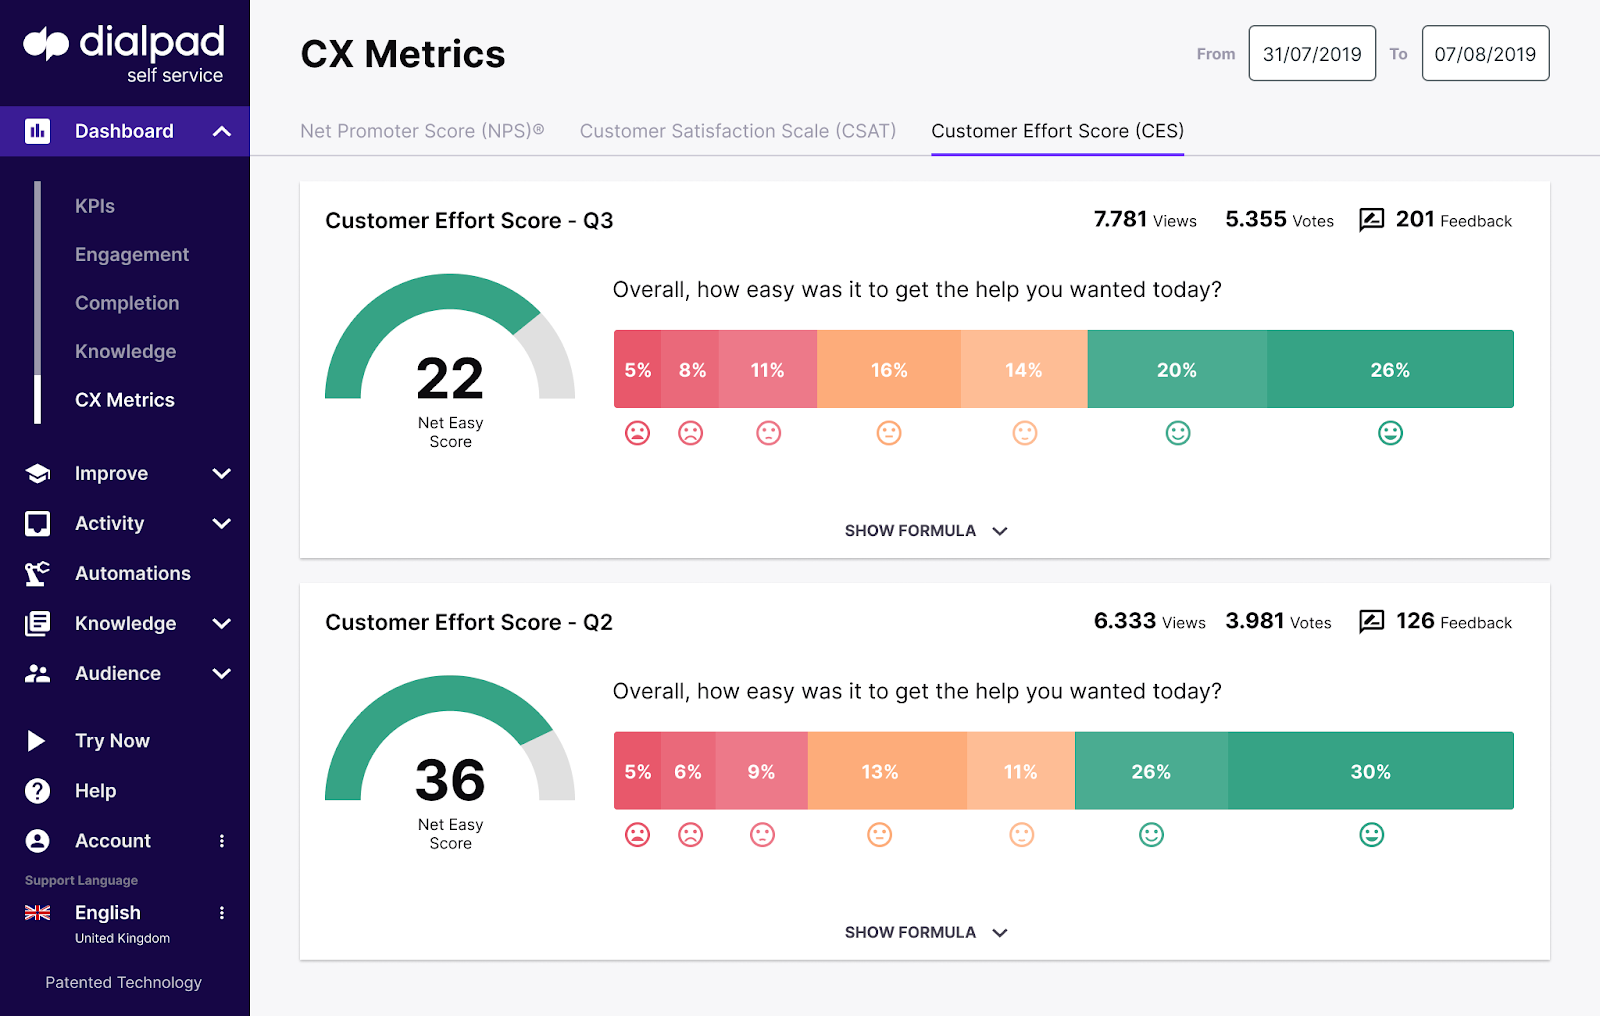
CX metric data
CX metric data gives a breakdown and clearer indication of customer satisfaction to the knowledge manager where deployed.
Dashboard>CX Metrics