- 13 Dec 2024
- 4 Minutes to read
- Print
- DarkLight
- PDF
Omnichannel Dashboard
- Updated on 13 Dec 2024
- 4 Minutes to read
- Print
- DarkLight
- PDF
Use Dialpad’s Omnichannel Dashboard to gain actionable insights on agent productivity, channel volumes, and customer interactions in your Digital Contact Center. With real-time data on agent and customer activities, you can make informed decisions to improve efficiency and performance and increase customer satisfaction.
Let’s dive into the details.
Who can use this
The Omnichannel Dashboard is available for Digital Engagement Admins and Supervisors on Dialpad Support and Dialpad Sell plans..
The Omnichannel Dashboard is currently only available to new Omnichannel users — if you’ve been with Dialpad for a while, you’re likely using our Legacy Dashboard. Contact your Customer Success Manager if you’d like to migrate to the new dashboard.
Access Omnichannel Dashboard
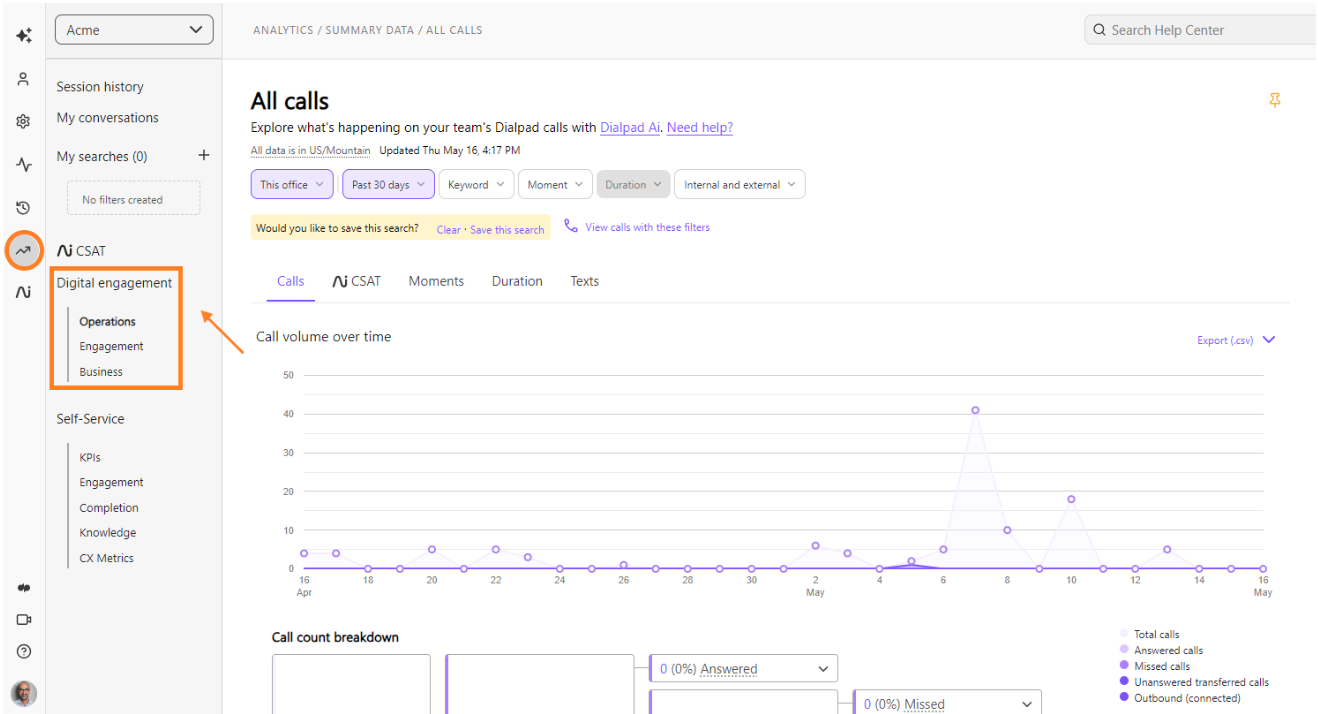
To access your Omnichannel Dashboard, head to your Dialpad Admin Settings.
Select Analytics
Navigate to Digital Engagement
Select any of the 3 menu options (Operations, Engagement, or Business)

You'll be taken to a new window containing your Omnichannel Dashboard.
Dashboard details
Your Omnichannel Dashboard contains a complete overview of what's going on in your Digital Contact Center.
Here, you’ll find details on active sessions, queue conditions, agents, and more.

Let's go over each section of the dashboard.
Active sessions
The Active Sessions section displays the number of active customer sessions. Here, you’ll see the total number of active sessions, as well as the number of sessions being handled by an agent or your bot.

Current queue length
The Current Queue Length section displays the number of sessions waiting for agents.

Available agents
The Available Agents section displays the number of agents that are available to take new sessions.

Estimated wait time
The Estimated Wait Time section displays the wait time for those in the queue.

Abandoned sessions
The Abandoned Sessions section shows the total number of sessions abandoned by the customer, including total abandoned sessions, that ended after more than one minute (long) and less than a minute (short). An agent session that was closed (for any reason) with no agent message is counted as an abandoned session.

Queue statistics
The Queue Statistics displays the number of abandoned sessions, timeouts and queue length per hour over the last two weeks.

Automation sessions
The Automation Sessions section shows the number of automation sessions per day over the last week that were handled, escalated to an agent or left unresolved.

Average response & handle times
The Average Response & Handle Times section displays the daily averages for the first response and handle times, as well as total agent sessions.

Average wait time (channel)
The Average Wait Time section shows the daily average wait times across each channel (for example, webchat, email, or WhatsApp).

Max wait time (channel)
The Max Wait time section shows the daily longest wait time customers experienced before getting assistance from your agents through each channel.

Automation session (channel)
The Automation Sessions section displays the daily number of automated sessions per channel/

Agent sessions (channel)
The Agent Sessions section displays the daily number of agent sessions per channel.

Survey Completion Daily
The Survey Completion daily section shows the average number of surveys offered and completed.

Average CSAT
The Average CSAT shows the average survey score per day.

Survey Engagement
The Survey Engagement section displays information on your CSAT scores. Here, you’ll find the totals for overal responses, as well as high and low CSAT engagement.

Agent handle time (channel)
The Agent Handle Time Daily section displays the daily average time agents spent (handled) per channel.

Total sessions (channel)
The Total Sessions section displays the total sessions per hour per channel, over the last week.

Total agent sessions (channel)
The Total Agent sessions display the total number of agent sessions per hour, per channel, over the last week.

Total automated sessions (channel)
The Total Automated Sessions section shows the total number of automated sessions per hour, per channel, over the last week.

Chat queues (channel)
The Chat Queues section displays the daily summary of all queues per channel. Here, you’ll find the daily details on how many interactions were answered by an agent, timed out, and abandoned.

Agent productivity (channel)
The Agent Productivity section shows the daily summary of each agent's number of sessions and the productivity metrics across each channel.

Agent productivity (skill)
The Agent Productivity section displays a daily report on your agent’s customer interactions and productivity, in each area of expertise or skill.

Tip
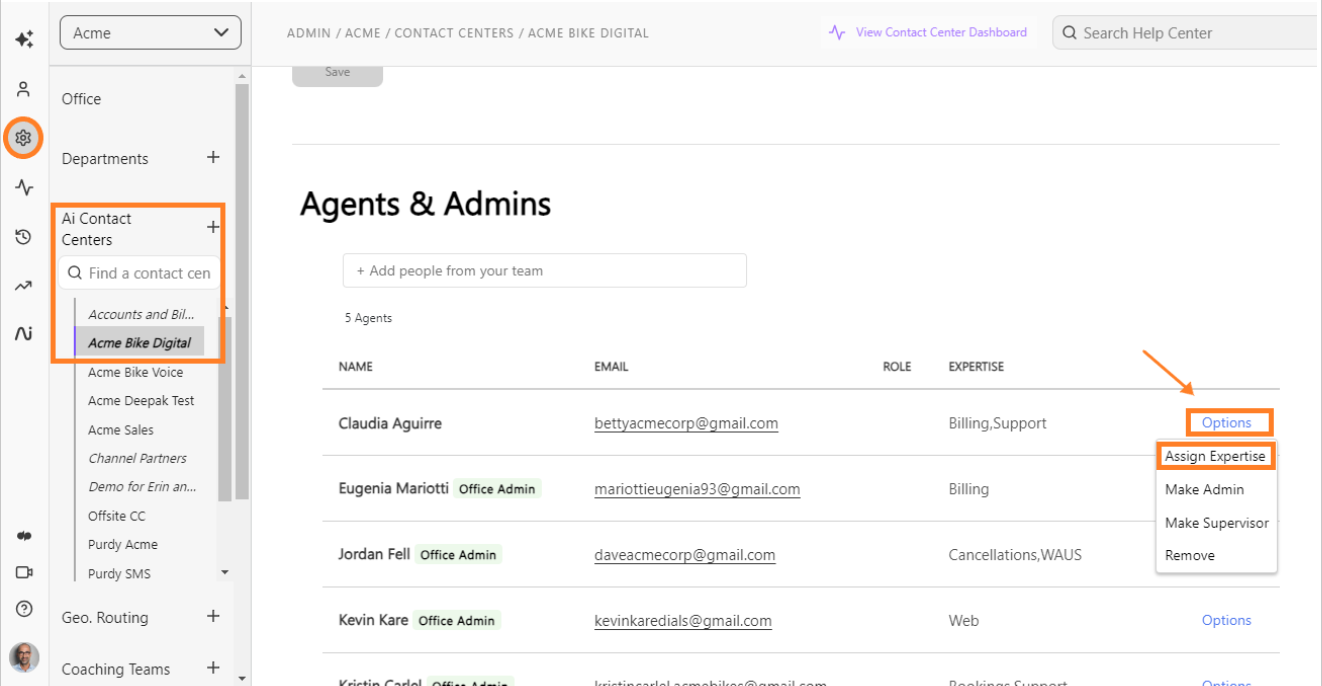
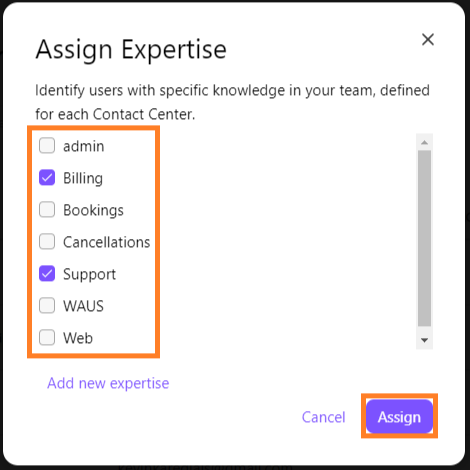
You can create and assign skill-based expertise for your agents from your Ai Contact Center settings.
Select a Contact Center
Navigate to Agents & Admins
Select an Agent
Select Options

Select Assign Expertise
Select an Expertise
Select Assign

Frequently asked questions
Why do all report names take me to the same dashboard?
We’re currently updating our left-hand navigation menu. While we work behind the scenes to make these updates, it's normal for all three options to take you to the same Omnichannel dashboard.
Why does my dashboard look different?
The Omnichannel Dashboard is currently available to new Digital Contact Center users. For existing users, nothing has changed, you’ll still see the legacy dashboards. The Omnichannel dashboard keeps all your data in one location, with additional data points added on abandoned sessions, max wait time (by channel) and automated sessions.


